29
/it/
it
AIzaSyAYiBZKx7MnpbEhh9jyipgxe19OcubqV5w
April 1, 2024
229298
Romania
ROU
true
2
1
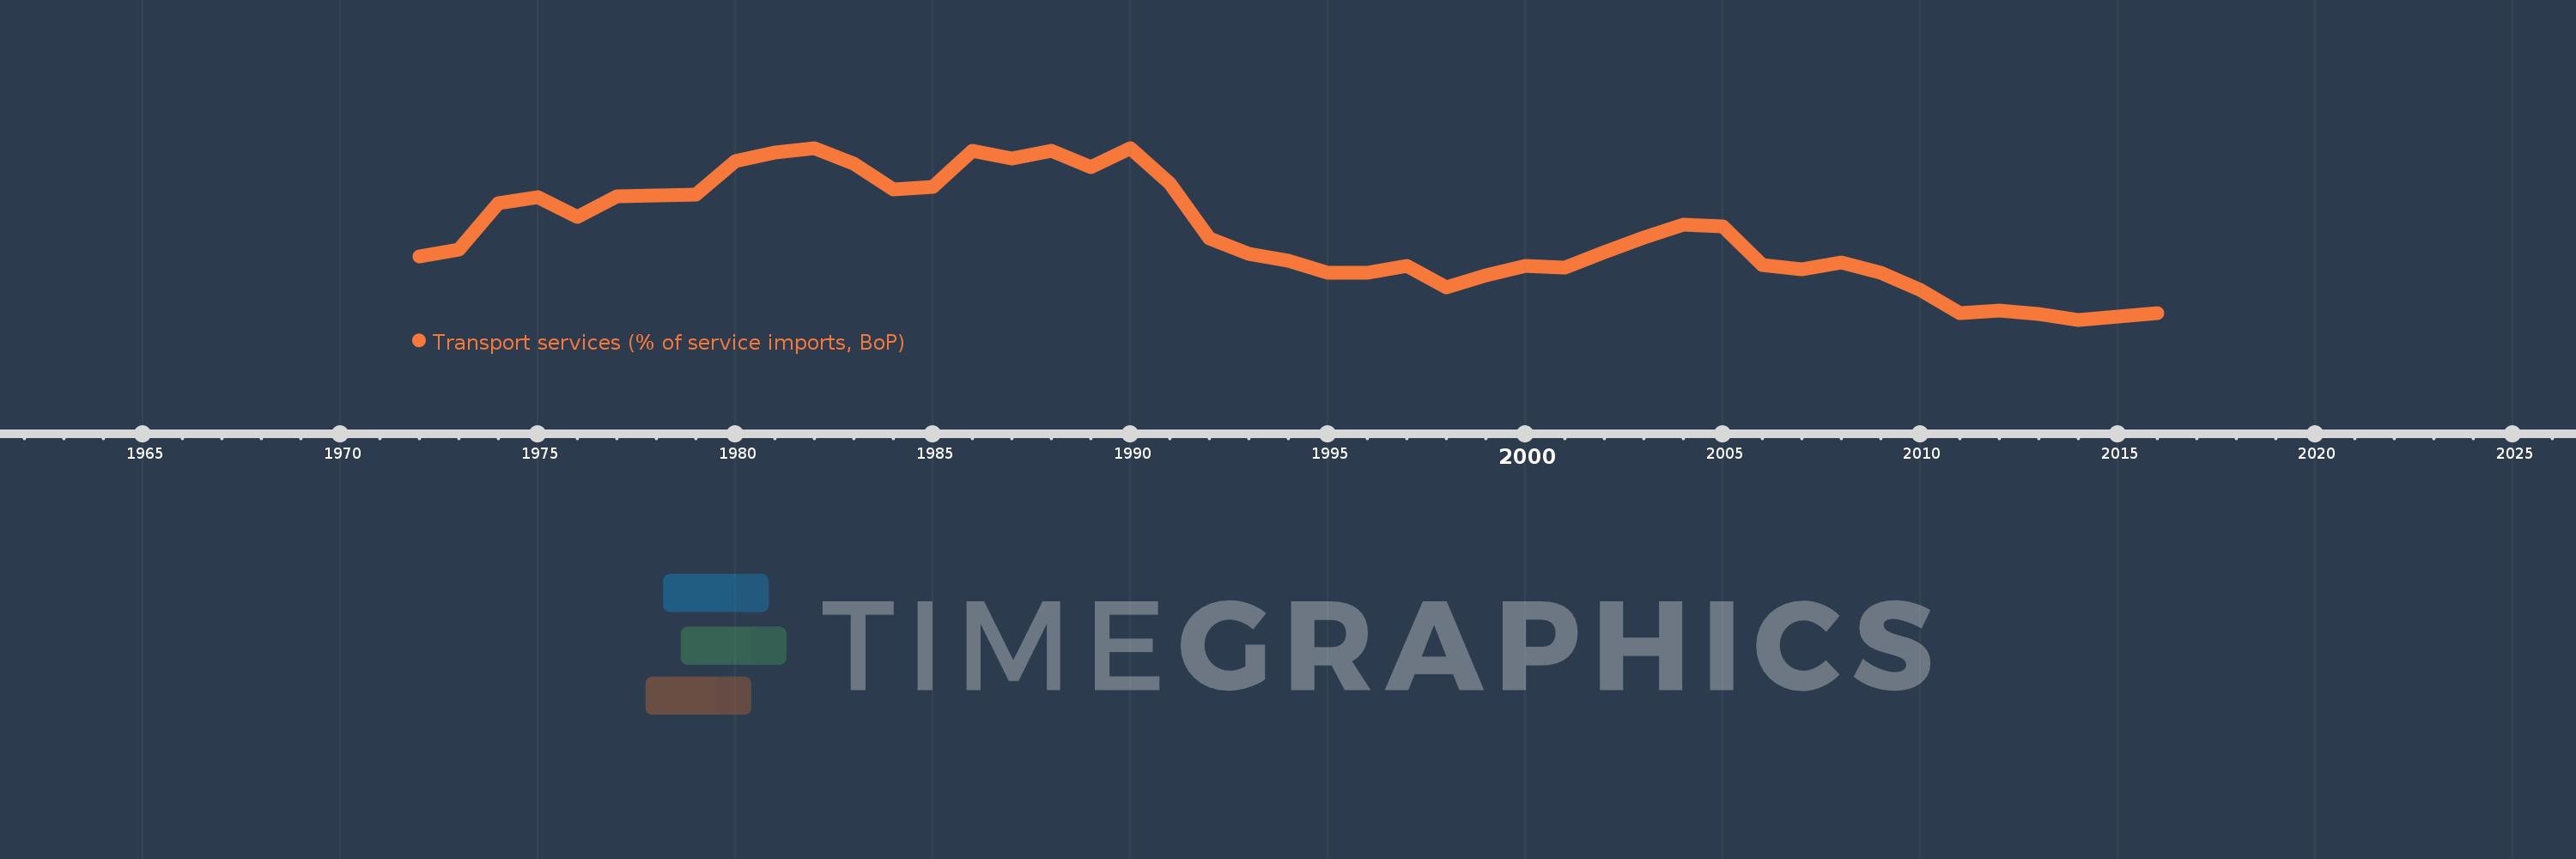
Transport services (% of service imports, BoP)
2016,2015,2014,2013,2012,2011,2010,2009,2008,2007,2006,2005,2004,2003,2002,2001,2000,1999,1998,1997,1996,1995,1994,1993,1992,1991,1990,1989,1988,1987,1986,1985,1984,1983,1982,1981,1980,1979,1978,1977,1976,1975,1974,1973,1972
Queste statistiche in altri paesi:
AfghanistanAlbaniaAlgeriaAngolaAntigua and BarbudaArab WorldArgentinaArmeniaArubaAustraliaAustriaAzerbaijanBahamas, TheBahrainBangladeshBarbadosBelarusBelgiumBelizeBeninBermudaBhutanBoliviaBosnia and HerzegovinaBotswanaBrazilBrunei DarussalamBulgariaBurkina FasoBurundiCabo VerdeCambodiaCameroonCanadaCaribbean small statesCentral African RepublicCentral Europe and the BalticsChadChileChinaColombiaComorosCongo, Dem. Rep.Congo, Rep.Costa RicaCote d'IvoireCroatiaCuracaoCyprusCzech RepublicDenmarkDjiboutiDominicaDominican RepublicEarly-demographic dividendEast Asia & PacificEast Asia & Pacific (excluding high income)East Asia & Pacific (IDA & IBRD countries)EcuadorEgypt, Arab Rep.El SalvadorEquatorial GuineaEritreaEstoniaEthiopiaEuro areaEurope & Central AsiaEurope & Central Asia (excluding high income)Europe & Central Asia (IDA & IBRD countries)European UnionFaroe IslandsFijiFinlandFragile and conflict affected situationsFranceFrench PolynesiaGabonGambia, TheGeorgiaGermanyGhanaGreeceGrenadaGuatemalaGuineaGuinea-BissauGuyanaHaitiHeavily indebted poor countries (HIPC)High incomeHondurasHong Kong SAR, ChinaHungaryIBRD onlyIcelandIDA & IBRD totalIDA onlyIDA totalIndiaIndonesiaIran, Islamic Rep.IraqIrelandIsraelItalyJamaicaJapanJordanKazakhstanKenyaKiribatiKorea, Rep.KosovoKuwaitKyrgyz RepublicLao PDRLate-demographic dividendLatin America & Caribbean Latin America & Caribbean (excluding high income)Latin America & the Caribbean (IDA & IBRD countries)LatviaLeast developed countries: UN classificationLebanonLesothoLiberiaLibyaLithuaniaLow & middle incomeLow incomeLower middle incomeLuxembourgMacao SAR, ChinaMacedonia, FYRMadagascarMalawiMalaysiaMaldivesMaliMaltaMarshall IslandsMauritaniaMauritiusMexicoMicronesia, Fed. Sts.Middle East & North AfricaMiddle East & North Africa (excluding high income)Middle East & North Africa (IDA & IBRD countries)Middle incomeMoldovaMongoliaMontenegroMoroccoMozambiqueMyanmarNamibiaNepalNetherlandsNew CaledoniaNew ZealandNicaraguaNigerNigeriaNorth AmericaNorwayOECD membersOmanOther small statesPacific island small statesPakistanPalauPanamaPapua New GuineaParaguayPeruPhilippinesPolandPortugalPost-demographic dividendPre-demographic dividendQatarRomaniaRussian FederationRwandaSamoaSao Tome and PrincipeSaudi ArabiaSenegalSerbiaSeychellesSierra LeoneSingaporeSint Maarten (Dutch part)Slovak RepublicSloveniaSmall statesSolomon IslandsSouth AfricaSouth AsiaSouth Asia (IDA & IBRD)South SudanSpainSri LankaSt. Kitts and NevisSt. LuciaSt. Vincent and the GrenadinesSub-Saharan Africa Sub-Saharan Africa (excluding high income)Sub-Saharan Africa (IDA & IBRD countries)SudanSurinameSwazilandSwedenSwitzerlandSyrian Arab RepublicTajikistanTanzaniaThailandTimor-LesteTogoTongaTrinidad and TobagoTunisiaTurkeyTuvaluUgandaUkraineUnited KingdomUnited StatesUpper middle incomeUruguayVanuatuVenezuela, RBWest Bank and GazaWorldYemen, Rep.ZambiaZimbabwe Linea del tempo:
Questa scala temporale mostra un grafico dal 1972 anno al 2016 anno. Romania. I dati fino ad 1971 anno non disponibili. Il numero di osservazioni attuali secondo i date: 45.
La fonte (nome):
Indicatori dello sviluppo mondiale
La fonte (organizzazione):
International Monetary Fund, Balance of Payments Statistics Yearbook and data files.
Categorie:
Economy & Growth, Trade
sono stati aggiornati
23 apr 2017 anni
Indicatori delle variazioni dei valori per anni
Minima:
15.871
1 gen 2014 anni
Massimo:
78.4
1 gen 1990 anni
Alla data di osservazione
Valore
Variazione assoluta
La variazione rispetto al valore precedente
1 gen 1972 anni
38.911
+38.911
0.0%
1 gen 1973 anni
41.492
+2.581
6.63%
1 gen 1974 anni
58.15
+16.659
40.15%
1 gen 1975 anni
60.637
+2.487
4.28%
1 gen 1976 anni
53.372
-7.265
-11.98%
1 gen 1977 anni
60.795
+7.423
13.91%
1 gen 1978 anni
61.139
+0.344
0.57%
1 gen 1979 anni
61.346
+0.207
0.34%
1 gen 1980 anni
73.663
+12.317
20.08%
1 gen 1981 anni
76.823
+3.16
4.29%
1 gen 1982 anni
78.195
+1.372
1.79%
1 gen 1983 anni
72.553
-5.642
-7.22%
1 gen 1984 anni
63.347
-9.206
-12.69%
1 gen 1985 anni
64.302
+0.955
1.51%
1 gen 1986 anni
77.462
+13.16
20.47%
1 gen 1987 anni
74.505
-2.957
-3.82%
1 gen 1988 anni
77.243
+2.738
3.67%
1 gen 1989 anni
71.438
-5.805
-7.52%
1 gen 1990 anni
78.4
+6.963
9.75%
1 gen 1991 anni
65.527
-12.873
-16.42%
1 gen 1992 anni
45.604
-19.923
-30.4%
1 gen 1993 anni
39.863
-5.742
-12.59%
1 gen 1994 anni
37.309
-2.554
-6.41%
1 gen 1995 anni
32.979
-4.33
-11.61%
1 gen 1996 anni
32.969
-0.009
-0.03%
1 gen 1997 anni
35.469
+2.5
7.58%
1 gen 1998 anni
27.786
-7.682
-21.66%
1 gen 1999 anni
32.19
+4.403
15.85%
1 gen 2000 anni
35.404
+3.214
9.99%
1 gen 2001 anni
34.989
-0.415
-1.17%
1 gen 2002 anni
40.616
+5.628
16.08%
1 gen 2003 anni
45.653
+5.037
12.4%
1 gen 2004 anni
50.4
+4.747
10.4%
1 gen 2005 anni
49.801
-0.6
-1.19%
1 gen 2006 anni
35.795
-14.006
-28.12%
1 gen 2007 anni
34.351
-1.443
-4.03%
1 gen 2008 anni
36.667
+2.316
6.74%
1 gen 2009 anni
32.962
-3.705
-10.1%
1 gen 2010 anni
26.714
-6.249
-18.96%
1 gen 2011 anni
18.255
-8.458
-31.66%
1 gen 2012 anni
19.162
+0.907
4.97%
1 gen 2013 anni
17.939
-1.223
-6.38%
1 gen 2014 anni
15.871
-2.068
-11.53%
1 gen 2015 anni
17.097
+1.226
7.72%
1 gen 2016 anni
18.245
+1.148
6.72%
Classificazione dei paesi secondo i statistiche attuali per anni


Commenti: