29
/it/
it
AIzaSyAYiBZKx7MnpbEhh9jyipgxe19OcubqV5w
April 1, 2024
222347
Peru
PER
true
2
1
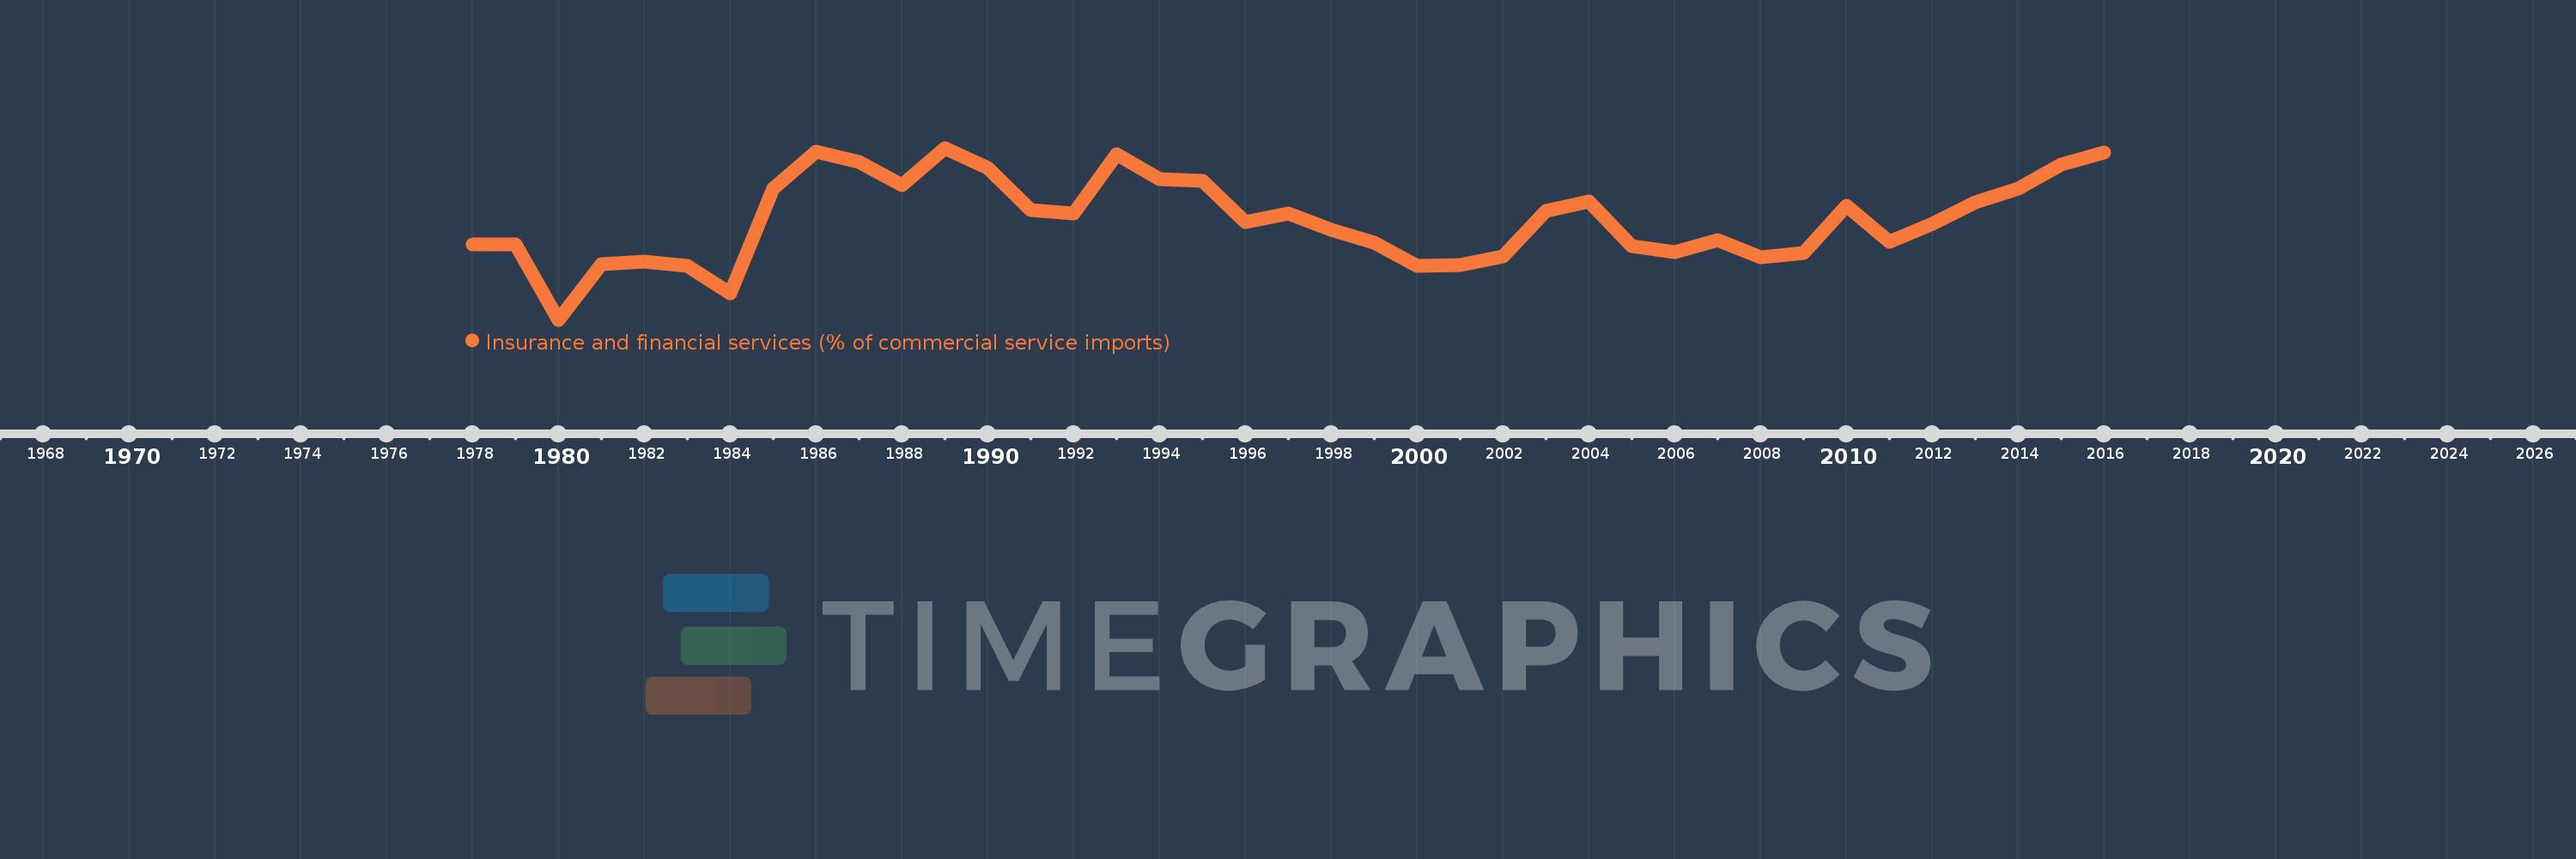
Insurance and financial services (% of commercial service imports)
2016,2015,2014,2013,2012,2011,2010,2009,2008,2007,2006,2005,2004,2003,2002,2001,2000,1999,1998,1997,1996,1995,1994,1993,1992,1991,1990,1989,1988,1987,1986,1985,1984,1983,1982,1981,1980,1979,1978
Queste statistiche in altri paesi:
AfghanistanAlbaniaAlgeriaAngolaAntigua and BarbudaArab WorldArgentinaArmeniaArubaAustraliaAustriaAzerbaijanBahamas, TheBahrainBangladeshBarbadosBelarusBelgiumBelizeBeninBermudaBhutanBoliviaBosnia and HerzegovinaBotswanaBrazilBrunei DarussalamBulgariaBurkina FasoBurundiCabo VerdeCambodiaCameroonCanadaCaribbean small statesCentral African RepublicCentral Europe and the BalticsChadChileChinaColombiaComorosCongo, Dem. Rep.Congo, Rep.Costa RicaCote d'IvoireCroatiaCuracaoCyprusCzech RepublicDenmarkDjiboutiDominicaDominican RepublicEarly-demographic dividendEast Asia & PacificEast Asia & Pacific (excluding high income)East Asia & Pacific (IDA & IBRD countries)EcuadorEgypt, Arab Rep.El SalvadorEquatorial GuineaEritreaEstoniaEthiopiaEuro areaEurope & Central AsiaEurope & Central Asia (excluding high income)Europe & Central Asia (IDA & IBRD countries)European UnionFaroe IslandsFijiFinlandFragile and conflict affected situationsFranceFrench PolynesiaGabonGambia, TheGeorgiaGermanyGhanaGreeceGrenadaGuatemalaGuineaGuinea-BissauGuyanaHaitiHeavily indebted poor countries (HIPC)High incomeHondurasHong Kong SAR, ChinaHungaryIBRD onlyIcelandIDA & IBRD totalIDA onlyIDA totalIndiaIndonesiaIran, Islamic Rep.IraqIrelandIsraelItalyJamaicaJapanJordanKazakhstanKenyaKiribatiKorea, Rep.KosovoKuwaitKyrgyz RepublicLao PDRLate-demographic dividendLatin America & Caribbean Latin America & Caribbean (excluding high income)Latin America & the Caribbean (IDA & IBRD countries)LatviaLeast developed countries: UN classificationLebanonLesothoLiberiaLibyaLithuaniaLow & middle incomeLow incomeLower middle incomeLuxembourgMacao SAR, ChinaMacedonia, FYRMadagascarMalawiMalaysiaMaldivesMaliMaltaMarshall IslandsMauritaniaMauritiusMexicoMicronesia, Fed. Sts.Middle East & North AfricaMiddle East & North Africa (excluding high income)Middle East & North Africa (IDA & IBRD countries)Middle incomeMoldovaMongoliaMontenegroMoroccoMozambiqueMyanmarNamibiaNepalNetherlandsNew CaledoniaNew ZealandNicaraguaNigerNigeriaNorth AmericaNorwayOECD membersOmanOther small statesPacific island small statesPakistanPalauPanamaPapua New GuineaParaguayPeruPhilippinesPolandPortugalPost-demographic dividendPre-demographic dividendQatarRomaniaRussian FederationRwandaSamoaSao Tome and PrincipeSaudi ArabiaSenegalSerbiaSeychellesSierra LeoneSingaporeSint Maarten (Dutch part)Slovak RepublicSloveniaSmall statesSolomon IslandsSouth AfricaSouth AsiaSouth Asia (IDA & IBRD)South SudanSpainSri LankaSt. Kitts and NevisSt. LuciaSt. Vincent and the GrenadinesSub-Saharan Africa Sub-Saharan Africa (excluding high income)Sub-Saharan Africa (IDA & IBRD countries)SudanSurinameSwazilandSwedenSwitzerlandSyrian Arab RepublicTajikistanTanzaniaThailandTimor-LesteTogoTongaTrinidad and TobagoTunisiaTurkeyTuvaluUgandaUkraineUnited KingdomUnited StatesUpper middle incomeUruguayVanuatuVenezuela, RBWest Bank and GazaWorldYemen, Rep.ZambiaZimbabwe Linea del tempo:
Questa scala temporale mostra un grafico dal 1978 anno al 2016 anno. Peru. I dati fino ad 1977 anno non disponibili. Il numero di osservazioni attuali secondo i date: 39.
La fonte (nome):
Indicatori dello sviluppo mondiale
La fonte (organizzazione):
International Monetary Fund, Balance of Payments Statistics Yearbook and data files.
Categorie:
Private Sector, Trade
sono stati aggiornati
23 apr 2017 anni
Indicatori delle variazioni dei valori per anni
Minima:
4.393
1 gen 1980 anni
Massimo:
14.535
1 gen 1989 anni
Alla data di osservazione
Valore
Variazione assoluta
La variazione rispetto al valore precedente
1 gen 1978 anni
8.84
+8.84
0.0%
1 gen 1979 anni
8.817
-0.023
-0.26%
1 gen 1980 anni
4.393
-4.425
-50.18%
1 gen 1981 anni
7.683
+3.29
74.91%
1 gen 1982 anni
7.835
+0.152
1.98%
1 gen 1983 anni
7.588
-0.248
-3.16%
1 gen 1984 anni
5.942
-1.646
-21.69%
1 gen 1985 anni
12.15
+6.208
104.48%
1 gen 1986 anni
14.336
+2.186
18.0%
1 gen 1987 anni
13.711
-0.625
-4.36%
1 gen 1988 anni
12.319
-1.392
-10.16%
1 gen 1989 anni
14.535
+2.216
17.99%
1 gen 1990 anni
13.365
-1.17
-8.05%
1 gen 1991 anni
10.874
-2.491
-18.64%
1 gen 1992 anni
10.69
-0.184
-1.69%
1 gen 1993 anni
14.19
+3.5
32.74%
1 gen 1994 anni
12.674
-1.516
-10.68%
1 gen 1995 anni
12.578
-0.096
-0.76%
1 gen 1996 anni
10.146
-2.432
-19.34%
1 gen 1997 anni
10.684
+0.538
5.31%
1 gen 1998 anni
9.726
-0.958
-8.97%
1 gen 1999 anni
8.935
-0.792
-8.14%
1 gen 2000 anni
7.594
-1.341
-15.01%
1 gen 2001 anni
7.632
+0.038
0.5%
1 gen 2002 anni
8.123
+0.491
6.43%
1 gen 2003 anni
10.807
+2.684
33.04%
1 gen 2004 anni
11.398
+0.591
5.47%
1 gen 2005 anni
8.742
-2.656
-23.3%
1 gen 2006 anni
8.389
-0.354
-4.04%
1 gen 2007 anni
9.072
+0.683
8.14%
1 gen 2008 anni
8.067
-1.005
-11.08%
1 gen 2009 anni
8.34
+0.274
3.4%
1 gen 2010 anni
11.105
+2.764
33.15%
1 gen 2011 anni
8.975
-2.13
-19.18%
1 gen 2012 anni
10.076
+1.101
12.27%
1 gen 2013 anni
11.331
+1.255
12.45%
1 gen 2014 anni
12.132
+0.801
7.07%
1 gen 2015 anni
13.543
+1.411
11.63%
1 gen 2016 anni
14.258
+0.715
5.28%
Classificazione dei paesi secondo i statistiche attuali per anni


Commenti: