29
/it/
it
AIzaSyAYiBZKx7MnpbEhh9jyipgxe19OcubqV5w
April 1, 2024
210532
Nicaragua
NIC
true
2
1
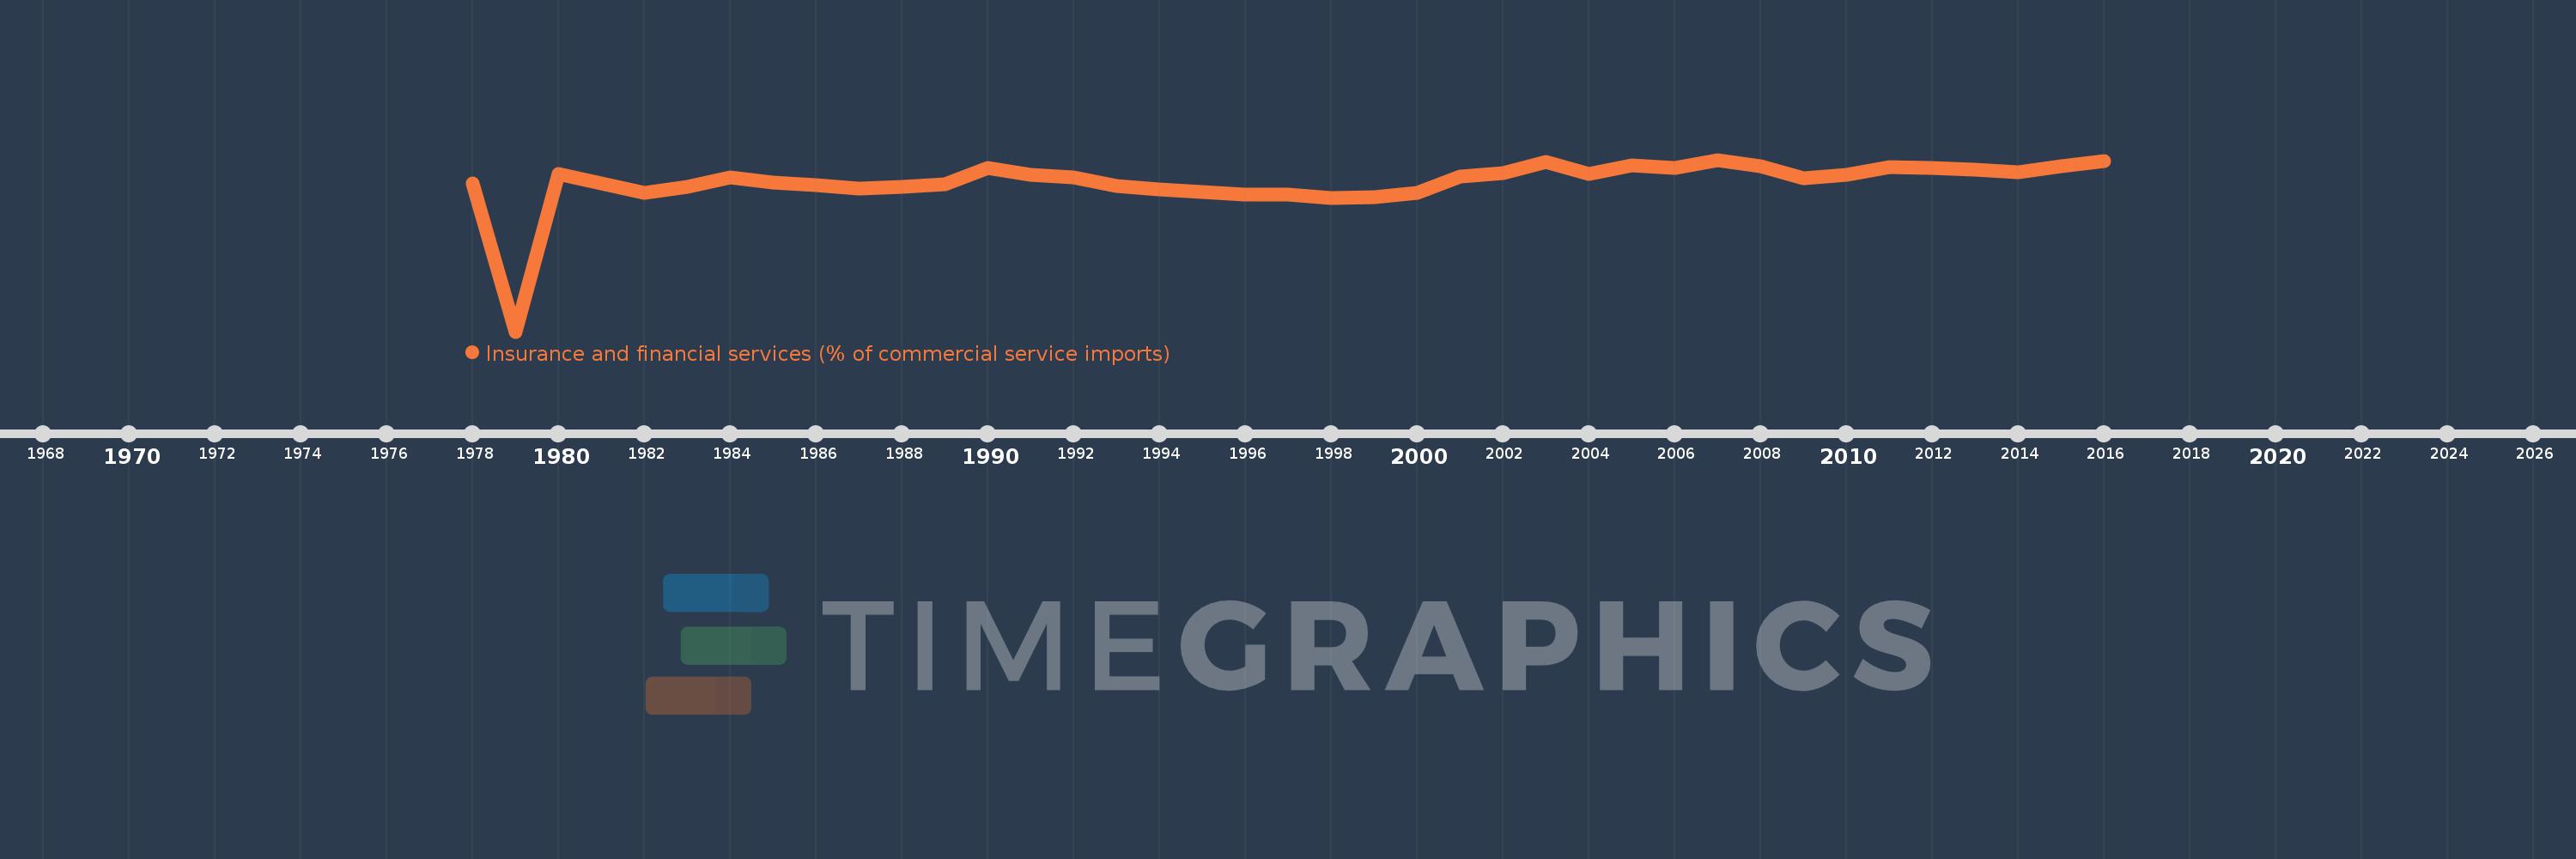
Insurance and financial services (% of commercial service imports)
2016,2015,2014,2013,2012,2011,2010,2009,2008,2007,2006,2005,2004,2003,2002,2001,2000,1999,1998,1997,1996,1995,1994,1993,1992,1991,1990,1989,1988,1987,1986,1985,1984,1983,1982,1981,1980,1979,1978
Queste statistiche in altri paesi:
AfghanistanAlbaniaAlgeriaAngolaAntigua and BarbudaArab WorldArgentinaArmeniaArubaAustraliaAustriaAzerbaijanBahamas, TheBahrainBangladeshBarbadosBelarusBelgiumBelizeBeninBermudaBhutanBoliviaBosnia and HerzegovinaBotswanaBrazilBrunei DarussalamBulgariaBurkina FasoBurundiCabo VerdeCambodiaCameroonCanadaCaribbean small statesCentral African RepublicCentral Europe and the BalticsChadChileChinaColombiaComorosCongo, Dem. Rep.Congo, Rep.Costa RicaCote d'IvoireCroatiaCuracaoCyprusCzech RepublicDenmarkDjiboutiDominicaDominican RepublicEarly-demographic dividendEast Asia & PacificEast Asia & Pacific (excluding high income)East Asia & Pacific (IDA & IBRD countries)EcuadorEgypt, Arab Rep.El SalvadorEquatorial GuineaEritreaEstoniaEthiopiaEuro areaEurope & Central AsiaEurope & Central Asia (excluding high income)Europe & Central Asia (IDA & IBRD countries)European UnionFaroe IslandsFijiFinlandFragile and conflict affected situationsFranceFrench PolynesiaGabonGambia, TheGeorgiaGermanyGhanaGreeceGrenadaGuatemalaGuineaGuinea-BissauGuyanaHaitiHeavily indebted poor countries (HIPC)High incomeHondurasHong Kong SAR, ChinaHungaryIBRD onlyIcelandIDA & IBRD totalIDA onlyIDA totalIndiaIndonesiaIran, Islamic Rep.IraqIrelandIsraelItalyJamaicaJapanJordanKazakhstanKenyaKiribatiKorea, Rep.KosovoKuwaitKyrgyz RepublicLao PDRLate-demographic dividendLatin America & Caribbean Latin America & Caribbean (excluding high income)Latin America & the Caribbean (IDA & IBRD countries)LatviaLeast developed countries: UN classificationLebanonLesothoLiberiaLibyaLithuaniaLow & middle incomeLow incomeLower middle incomeLuxembourgMacao SAR, ChinaMacedonia, FYRMadagascarMalawiMalaysiaMaldivesMaliMaltaMarshall IslandsMauritaniaMauritiusMexicoMicronesia, Fed. Sts.Middle East & North AfricaMiddle East & North Africa (excluding high income)Middle East & North Africa (IDA & IBRD countries)Middle incomeMoldovaMongoliaMontenegroMoroccoMozambiqueMyanmarNamibiaNepalNetherlandsNew CaledoniaNew ZealandNicaraguaNigerNigeriaNorth AmericaNorwayOECD membersOmanOther small statesPacific island small statesPakistanPalauPanamaPapua New GuineaParaguayPeruPhilippinesPolandPortugalPost-demographic dividendPre-demographic dividendQatarRomaniaRussian FederationRwandaSamoaSao Tome and PrincipeSaudi ArabiaSenegalSerbiaSeychellesSierra LeoneSingaporeSint Maarten (Dutch part)Slovak RepublicSloveniaSmall statesSolomon IslandsSouth AfricaSouth AsiaSouth Asia (IDA & IBRD)South SudanSpainSri LankaSt. Kitts and NevisSt. LuciaSt. Vincent and the GrenadinesSub-Saharan Africa Sub-Saharan Africa (excluding high income)Sub-Saharan Africa (IDA & IBRD countries)SudanSurinameSwazilandSwedenSwitzerlandSyrian Arab RepublicTajikistanTanzaniaThailandTimor-LesteTogoTongaTrinidad and TobagoTunisiaTurkeyTuvaluUgandaUkraineUnited KingdomUnited StatesUpper middle incomeUruguayVanuatuVenezuela, RBWest Bank and GazaWorldYemen, Rep.ZambiaZimbabwe Linea del tempo:
Questa scala temporale mostra un grafico dal 1978 anno al 2016 anno. Nicaragua. I dati fino ad 1977 anno non disponibili. Il numero di osservazioni attuali secondo i date: 39.
La fonte (nome):
Indicatori dello sviluppo mondiale
La fonte (organizzazione):
International Monetary Fund, Balance of Payments Statistics Yearbook and data files.
Categorie:
Private Sector, Trade
sono stati aggiornati
23 apr 2017 anni
Indicatori delle variazioni dei valori per anni
Minima:
-28.614
1 gen 1979 anni
Massimo:
11.452
1 gen 2007 anni
Alla data di osservazione
Valore
Variazione assoluta
La variazione rispetto al valore precedente
1 gen 1978 anni
5.961
+5.961
0.0%
1 gen 1979 anni
-28.614
-34.575
-580.0%
1 gen 1980 anni
8.048
+36.662
-128.13%
1 gen 1981 anni
5.889
-2.16
-26.83%
1 gen 1982 anni
3.814
-2.074
-35.23%
1 gen 1983 anni
5.079
+1.264
33.14%
1 gen 1984 anni
7.249
+2.171
42.74%
1 gen 1985 anni
6.184
-1.065
-14.7%
1 gen 1986 anni
5.633
-0.551
-8.91%
1 gen 1987 anni
4.714
-0.919
-16.31%
1 gen 1988 anni
5.171
+0.457
9.7%
1 gen 1989 anni
5.793
+0.622
12.02%
1 gen 1990 anni
9.483
+3.69
63.7%
1 gen 1991 anni
7.913
-1.57
-16.56%
1 gen 1992 anni
7.311
-0.602
-7.61%
1 gen 1993 anni
5.277
-2.034
-27.82%
1 gen 1994 anni
4.614
-0.663
-12.56%
1 gen 1995 anni
3.89
-0.724
-15.7%
1 gen 1996 anni
3.28
-0.609
-15.67%
1 gen 1997 anni
3.347
+0.067
2.04%
1 gen 1998 anni
2.514
-0.833
-24.88%
1 gen 1999 anni
2.727
+0.213
8.47%
1 gen 2000 anni
3.671
+0.944
34.61%
1 gen 2001 anni
7.483
+3.812
103.83%
1 gen 2002 anni
8.434
+0.952
12.72%
1 gen 2003 anni
11.038
+2.604
30.87%
1 gen 2004 anni
8.095
-2.943
-26.66%
1 gen 2005 anni
10.179
+2.084
25.74%
1 gen 2006 anni
9.632
-0.547
-5.38%
1 gen 2007 anni
11.452
+1.82
18.89%
1 gen 2008 anni
9.938
-1.514
-13.22%
1 gen 2009 anni
7.144
-2.794
-28.12%
1 gen 2010 anni
7.891
+0.748
10.46%
1 gen 2011 anni
9.719
+1.828
23.16%
1 gen 2012 anni
9.5
-0.22
-2.26%
1 gen 2013 anni
9.203
-0.297
-3.13%
1 gen 2014 anni
8.504
-0.698
-7.59%
1 gen 2015 anni
10.032
+1.528
17.97%
1 gen 2016 anni
11.248
+1.215
12.11%
Classificazione dei paesi secondo i statistiche attuali per anni


Commenti: