29
/it/
it
AIzaSyAYiBZKx7MnpbEhh9jyipgxe19OcubqV5w
April 1, 2024
221745
Peru
PER
true
2
1
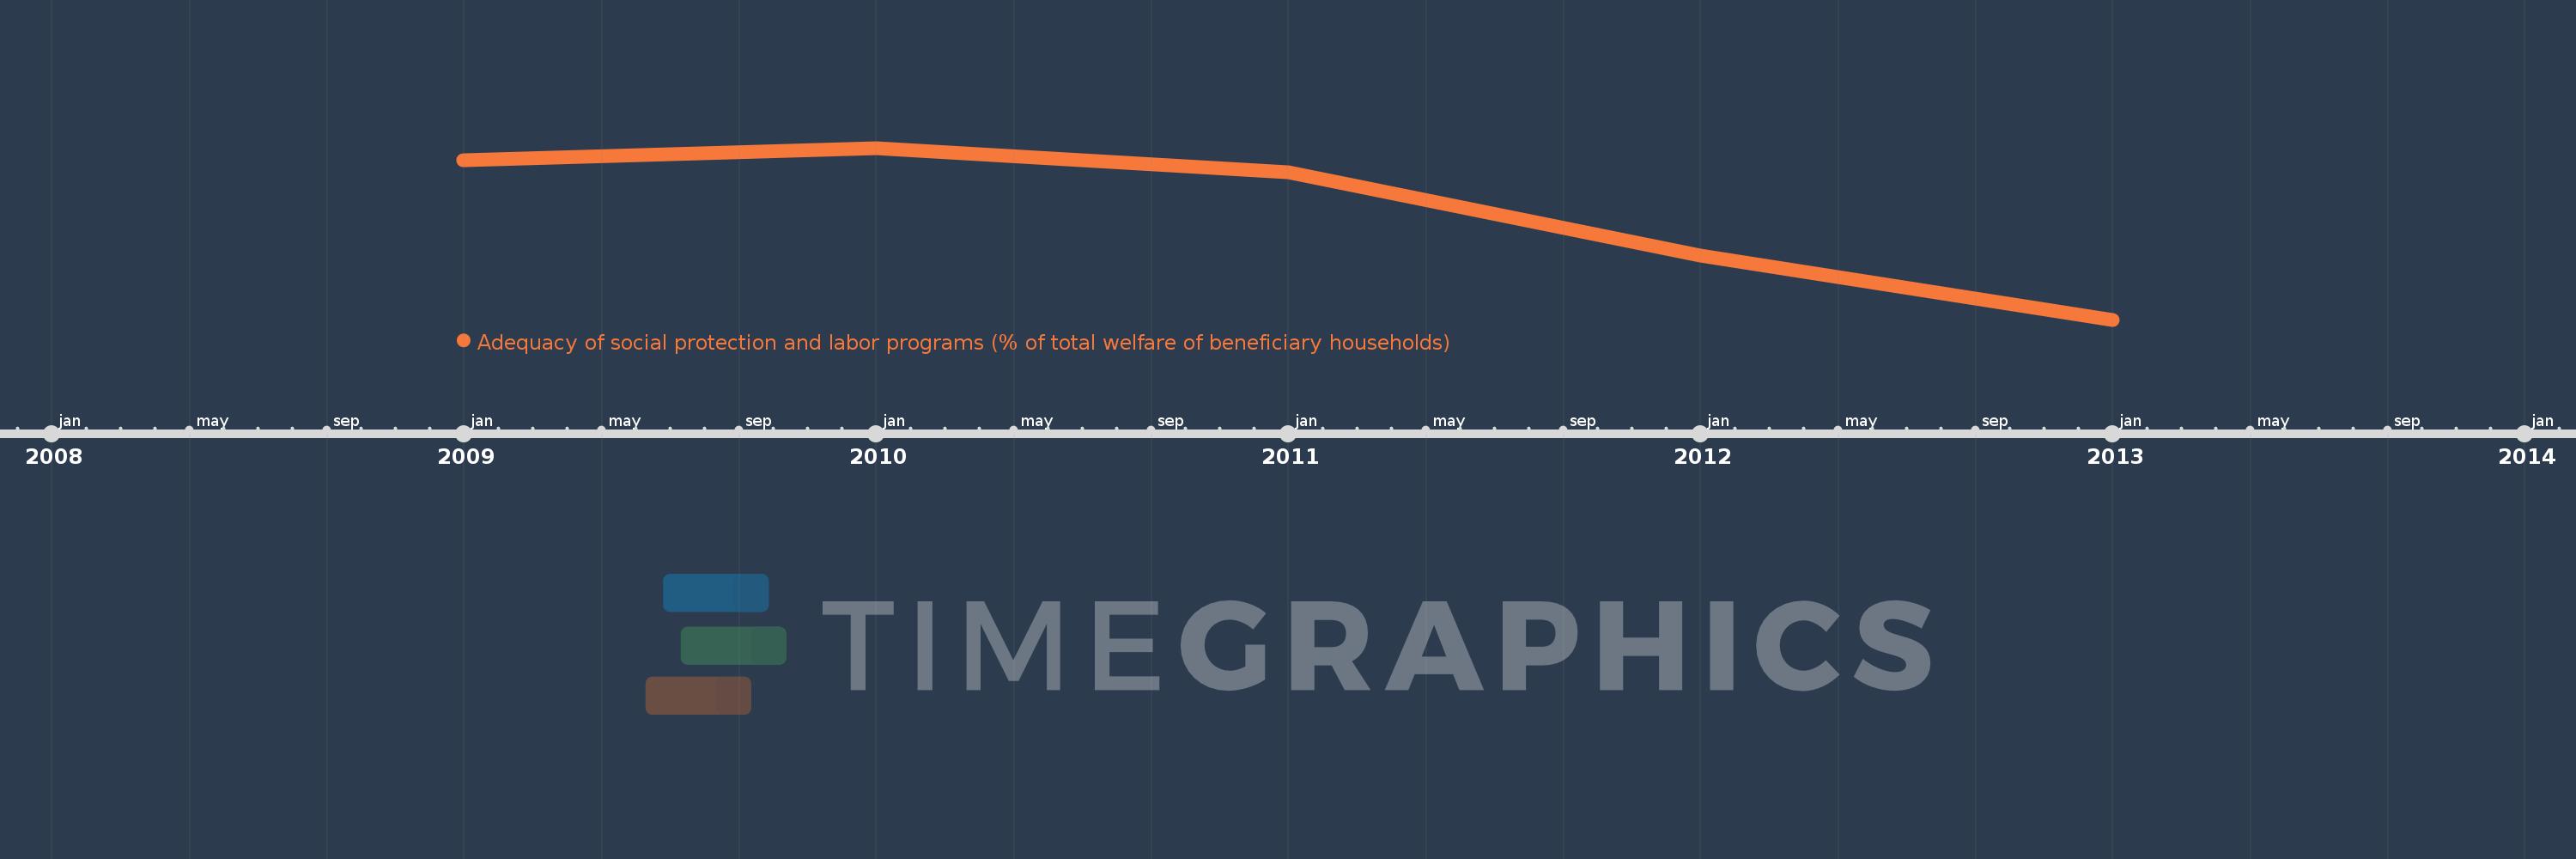
Adequacy of social protection and labor programs (% of total welfare of beneficiary households)
2013,2012,2011,2010,2009
Queste statistiche in altri paesi:
Linea del tempo:
Questa scala temporale mostra un grafico dal 2009 anno al 2013 anno. Peru. I dati fino ad 2008 anno non disponibili. Il numero di osservazioni attuali secondo i date: 5.
La fonte (nome):
Indicatori dello sviluppo mondiale
La fonte (organizzazione):
The Atlas of Social Protection: Indicators of Resilience and Equity (ASPIRE)
Categorie:
Social Protection & Labor
sono stati aggiornati
23 apr 2017 anni
Indicatori delle variazioni dei valori per anni
Minima:
19.573
1 gen 2013 anni
Massimo:
22.472
1 gen 2010 anni
Alla data di osservazione
Valore
Variazione assoluta
La variazione rispetto al valore precedente
1 gen 2009 anni
22.258
+22.258
0.0%
1 gen 2010 anni
22.472
+0.214
0.96%
1 gen 2011 anni
22.056
-0.417
-1.85%
1 gen 2012 anni
20.651
-1.405
-6.37%
1 gen 2013 anni
19.573
-1.078
-5.22%
Classificazione dei paesi secondo i statistiche attuali per anni


Commenti: