29
/it/
it
AIzaSyAYiBZKx7MnpbEhh9jyipgxe19OcubqV5w
April 1, 2024
111801
Costa Rica
CRI
true
2
1
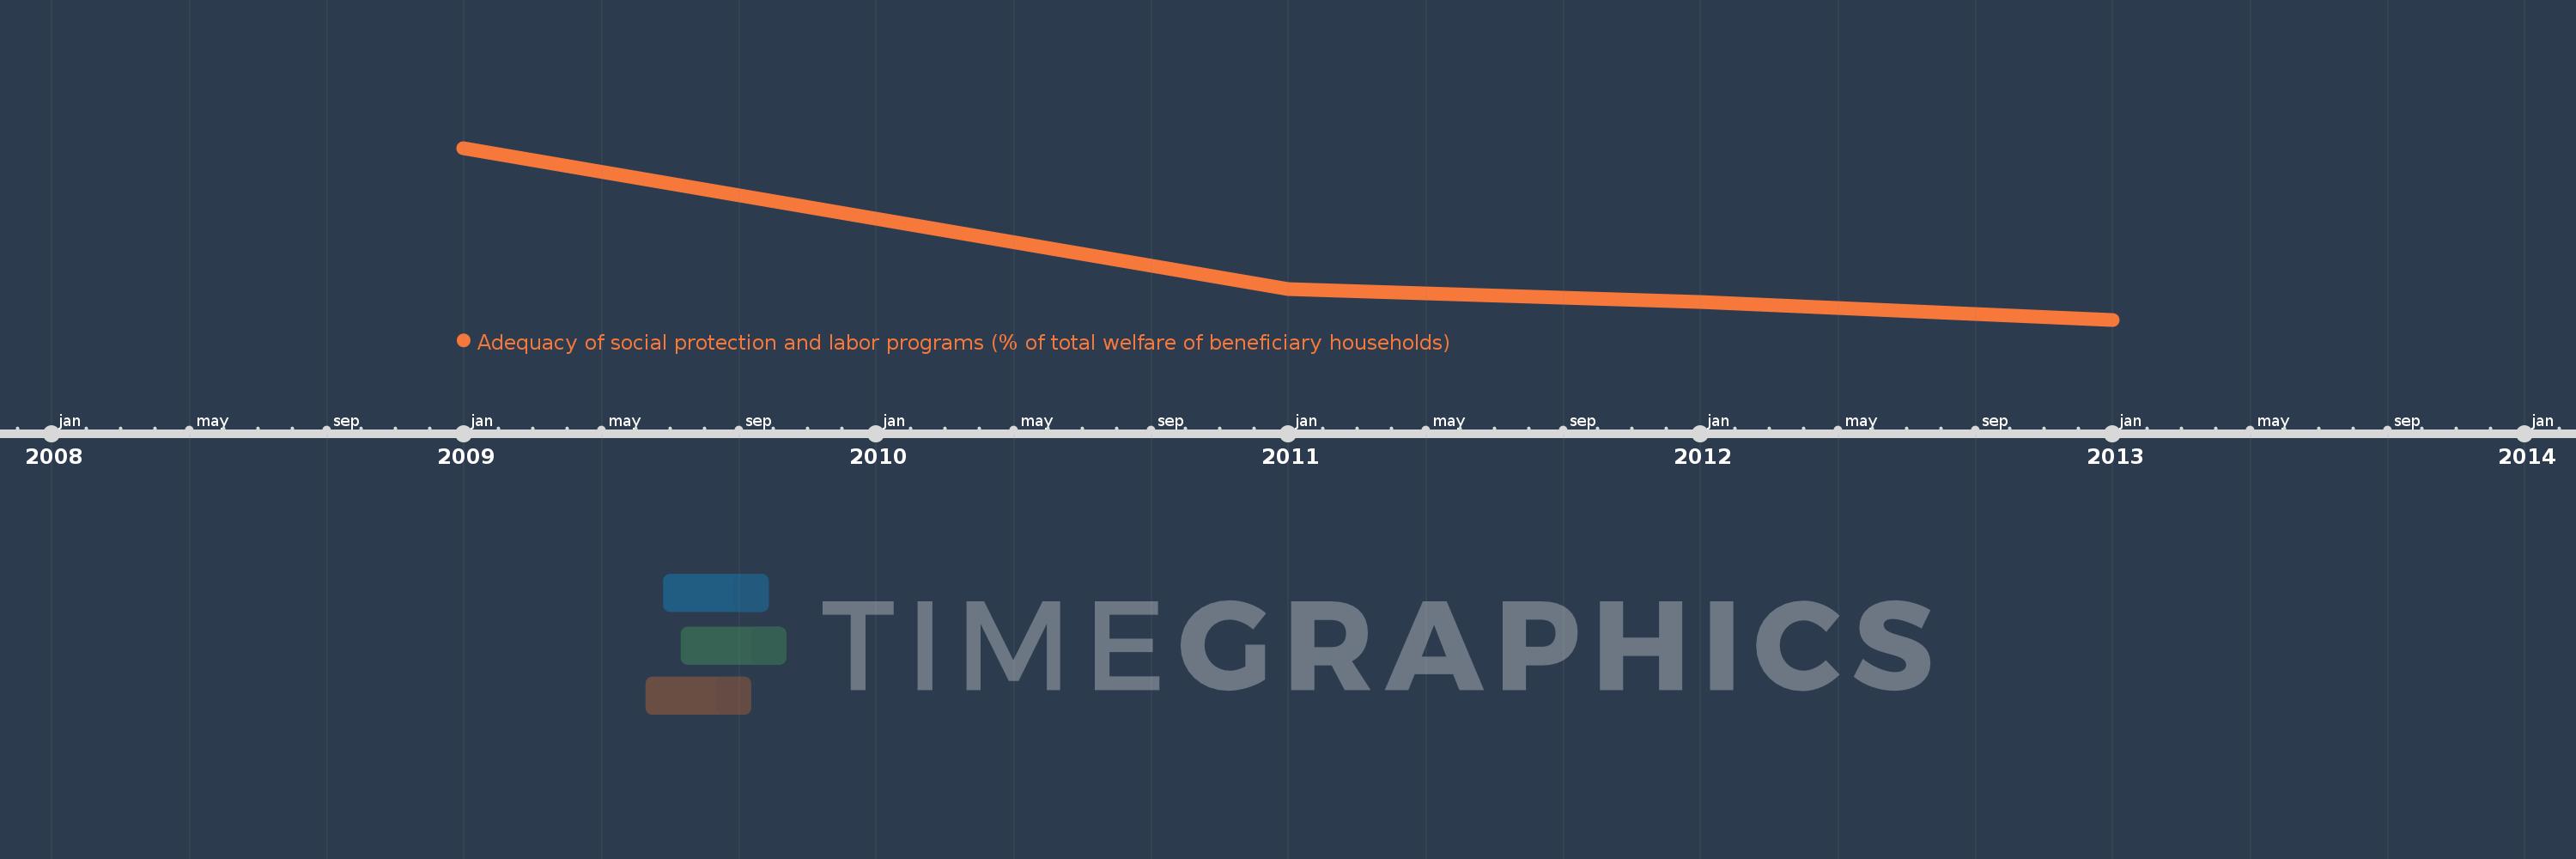
Adequacy of social protection and labor programs (% of total welfare of beneficiary households)
2013,2012,2011,2009
Queste statistiche in altri paesi:
Linea del tempo:
Questa scala temporale mostra un grafico dal 2009 anno al 2013 anno. Costa Rica. I dati fino ad 2008 anno non disponibili. Il numero di osservazioni attuali secondo i date: 4.
La fonte (nome):
Indicatori dello sviluppo mondiale
La fonte (organizzazione):
The Atlas of Social Protection: Indicators of Resilience and Equity (ASPIRE)
Categorie:
Social Protection & Labor
sono stati aggiornati
23 apr 2017 anni
Indicatori delle variazioni dei valori per anni
Minima:
24.66
1 gen 2013 anni
Massimo:
38.093
1 gen 2009 anni
Alla data di osservazione
Valore
Variazione assoluta
La variazione rispetto al valore precedente
1 gen 2009 anni
38.093
+38.093
0.0%
1 gen 2011 anni
27.064
-11.029
-28.95%
1 gen 2012 anni
26.049
-1.015
-3.75%
1 gen 2013 anni
24.66
-1.389
-5.33%
Classificazione dei paesi secondo i statistiche attuali per anni


Commenti: