29
/it/
it
AIzaSyAYiBZKx7MnpbEhh9jyipgxe19OcubqV5w
April 1, 2024
218099
Panama
PAN
true
2
1
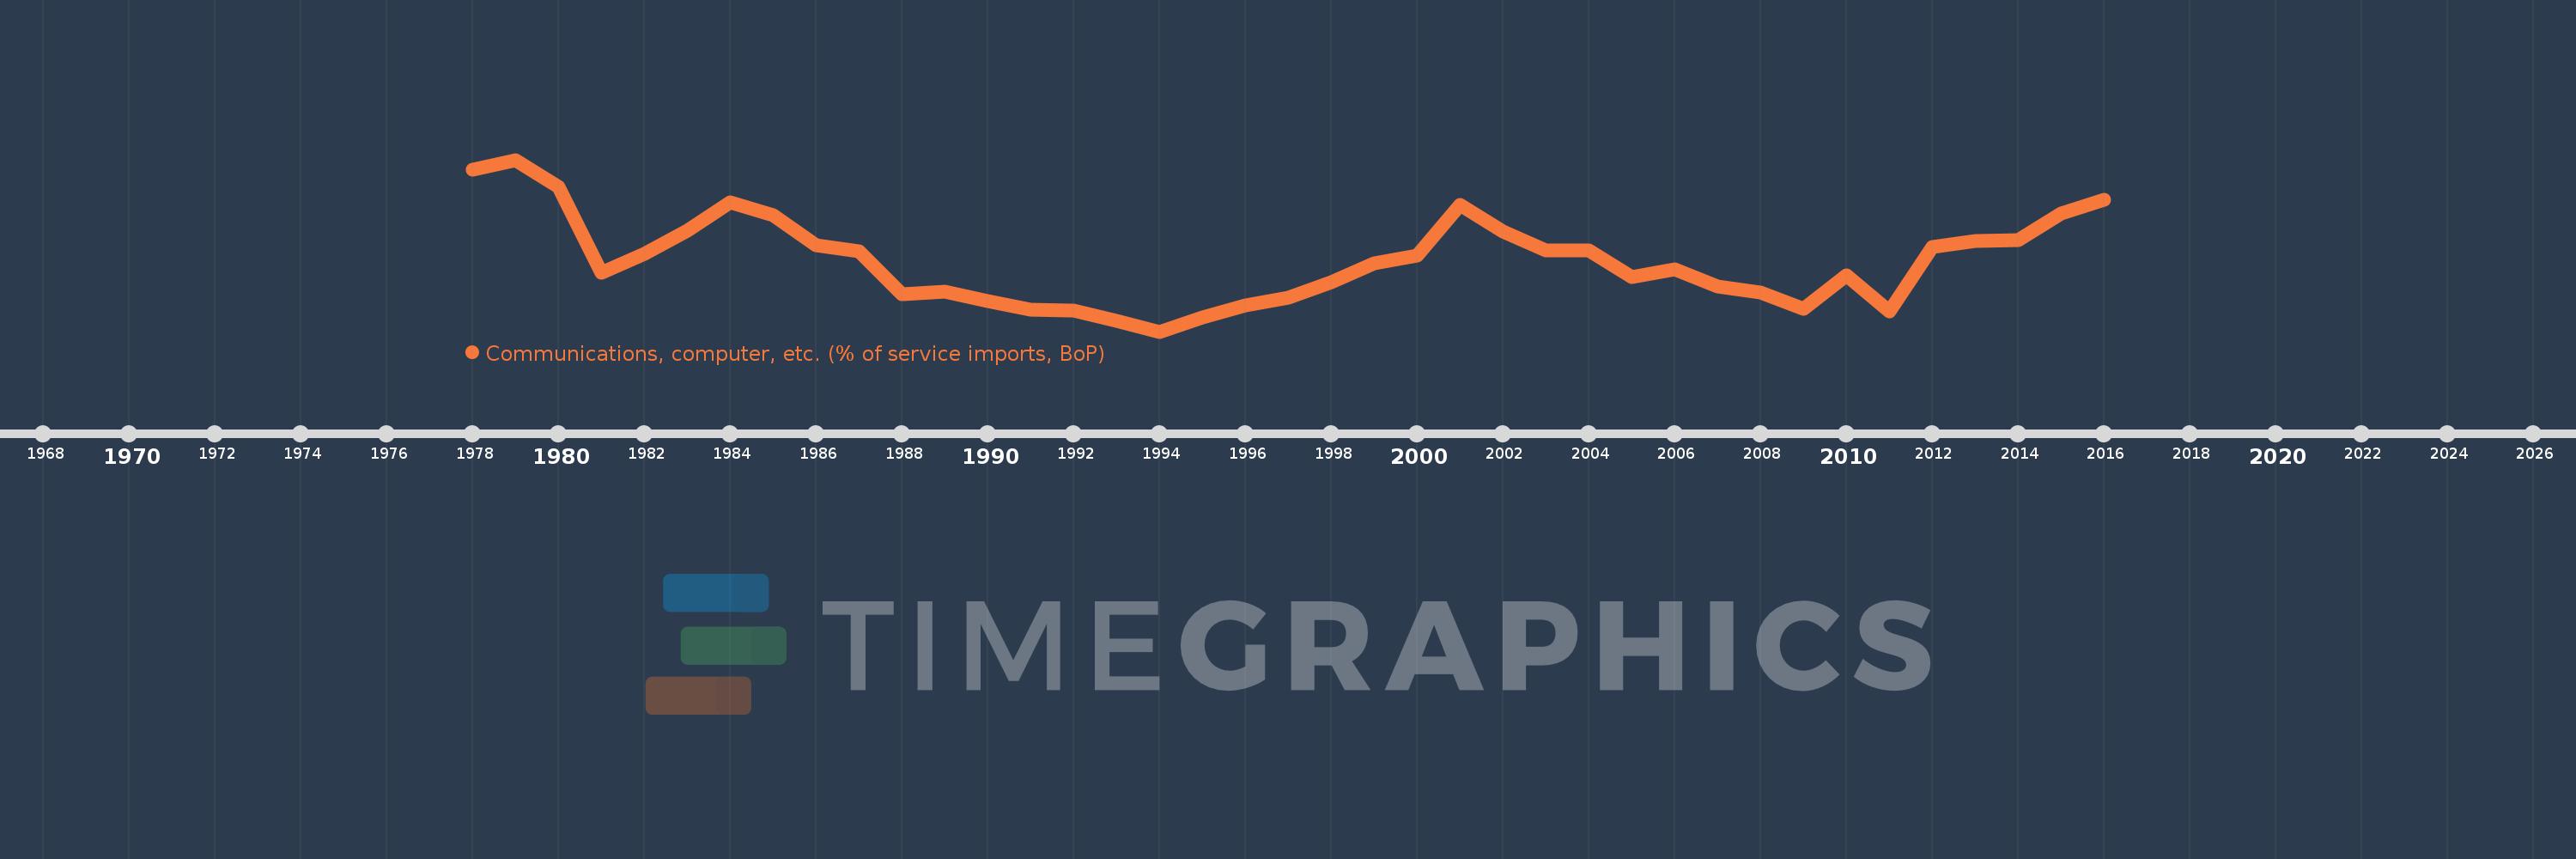
Communications, computer, etc. (% of service imports, BoP)
2016,2015,2014,2013,2012,2011,2010,2009,2008,2007,2006,2005,2004,2003,2002,2001,2000,1999,1998,1997,1996,1995,1994,1993,1992,1991,1990,1989,1988,1987,1986,1985,1984,1983,1982,1981,1980,1979,1978
Queste statistiche in altri paesi:
AfghanistanAlbaniaAlgeriaAngolaAntigua and BarbudaArab WorldArgentinaArmeniaArubaAustraliaAustriaAzerbaijanBahamas, TheBahrainBangladeshBarbadosBelarusBelgiumBelizeBeninBermudaBhutanBoliviaBosnia and HerzegovinaBotswanaBrazilBrunei DarussalamBulgariaBurkina FasoBurundiCabo VerdeCambodiaCameroonCanadaCaribbean small statesCentral African RepublicCentral Europe and the BalticsChadChileChinaColombiaComorosCongo, Dem. Rep.Congo, Rep.Costa RicaCote d'IvoireCroatiaCuracaoCyprusCzech RepublicDenmarkDjiboutiDominicaDominican RepublicEarly-demographic dividendEast Asia & PacificEast Asia & Pacific (excluding high income)East Asia & Pacific (IDA & IBRD countries)EcuadorEgypt, Arab Rep.El SalvadorEquatorial GuineaEritreaEstoniaEthiopiaEuro areaEurope & Central AsiaEurope & Central Asia (excluding high income)Europe & Central Asia (IDA & IBRD countries)European UnionFaroe IslandsFijiFinlandFragile and conflict affected situationsFranceFrench PolynesiaGabonGambia, TheGeorgiaGermanyGhanaGreeceGrenadaGuatemalaGuineaGuinea-BissauGuyanaHaitiHeavily indebted poor countries (HIPC)High incomeHondurasHong Kong SAR, ChinaHungaryIBRD onlyIcelandIDA & IBRD totalIDA onlyIDA totalIndiaIndonesiaIran, Islamic Rep.IraqIrelandIsraelItalyJamaicaJapanJordanKazakhstanKenyaKiribatiKorea, Rep.KosovoKuwaitKyrgyz RepublicLao PDRLate-demographic dividendLatin America & Caribbean Latin America & Caribbean (excluding high income)Latin America & the Caribbean (IDA & IBRD countries)LatviaLeast developed countries: UN classificationLebanonLesothoLiberiaLibyaLithuaniaLow & middle incomeLow incomeLower middle incomeLuxembourgMacao SAR, ChinaMacedonia, FYRMadagascarMalawiMalaysiaMaldivesMaliMaltaMarshall IslandsMauritaniaMauritiusMexicoMicronesia, Fed. Sts.Middle East & North AfricaMiddle East & North Africa (excluding high income)Middle East & North Africa (IDA & IBRD countries)Middle incomeMoldovaMongoliaMontenegroMoroccoMozambiqueMyanmarNamibiaNepalNetherlandsNew CaledoniaNew ZealandNicaraguaNigerNigeriaNorth AmericaNorwayOECD membersOmanOther small statesPacific island small statesPakistanPalauPanamaPapua New GuineaParaguayPeruPhilippinesPolandPortugalPost-demographic dividendPre-demographic dividendQatarRomaniaRussian FederationRwandaSamoaSao Tome and PrincipeSaudi ArabiaSenegalSerbiaSeychellesSierra LeoneSingaporeSint Maarten (Dutch part)Slovak RepublicSloveniaSmall statesSolomon IslandsSouth AfricaSouth AsiaSouth Asia (IDA & IBRD)South SudanSpainSri LankaSt. Kitts and NevisSt. LuciaSt. Vincent and the GrenadinesSub-Saharan Africa Sub-Saharan Africa (excluding high income)Sub-Saharan Africa (IDA & IBRD countries)SudanSurinameSwazilandSwedenSwitzerlandSyrian Arab RepublicTajikistanTanzaniaThailandTimor-LesteTogoTongaTrinidad and TobagoTunisiaTurkeyTuvaluUgandaUkraineUnited KingdomUnited StatesUpper middle incomeUruguayVanuatuVenezuela, RBWest Bank and GazaWorldYemen, Rep.ZambiaZimbabwe Linea del tempo:
Questa scala temporale mostra un grafico dal 1978 anno al 2016 anno. Panama. I dati fino ad 1977 anno non disponibili. Il numero di osservazioni attuali secondo i date: 39.
La fonte (nome):
Indicatori dello sviluppo mondiale
La fonte (organizzazione):
International Monetary Fund, Balance of Payments Statistics Yearbook and data files.
Categorie:
Economy & Growth, Trade
sono stati aggiornati
23 apr 2017 anni
Indicatori delle variazioni dei valori per anni
Minima:
9.401
1 gen 1994 anni
Massimo:
26.591
1 gen 1979 anni
Alla data di osservazione
Valore
Variazione assoluta
La variazione rispetto al valore precedente
1 gen 1978 anni
25.61
+25.61
0.0%
1 gen 1979 anni
26.591
+0.982
3.83%
1 gen 1980 anni
23.914
-2.677
-10.07%
1 gen 1981 anni
15.33
-8.584
-35.89%
1 gen 1982 anni
17.143
+1.813
11.83%
1 gen 1983 anni
19.536
+2.393
13.96%
1 gen 1984 anni
22.339
+2.803
14.35%
1 gen 1985 anni
21.083
-1.256
-5.62%
1 gen 1986 anni
18.006
-3.077
-14.59%
1 gen 1987 anni
17.411
-0.595
-3.31%
1 gen 1988 anni
13.123
-4.288
-24.63%
1 gen 1989 anni
13.355
+0.232
1.77%
1 gen 1990 anni
12.415
-0.94
-7.04%
1 gen 1991 anni
11.565
-0.85
-6.85%
1 gen 1992 anni
11.534
-0.031
-0.27%
1 gen 1993 anni
10.436
-1.098
-9.52%
1 gen 1994 anni
9.401
-1.035
-9.92%
1 gen 1995 anni
10.794
+1.393
14.82%
1 gen 1996 anni
12.062
+1.268
11.75%
1 gen 1997 anni
12.779
+0.717
5.95%
1 gen 1998 anni
14.366
+1.587
12.42%
1 gen 1999 anni
16.22
+1.854
12.9%
1 gen 2000 anni
16.972
+0.752
4.64%
1 gen 2001 anni
22.115
+5.143
30.3%
1 gen 2002 anni
19.447
-2.667
-12.06%
1 gen 2003 anni
17.49
-1.957
-10.06%
1 gen 2004 anni
17.557
+0.066
0.38%
1 gen 2005 anni
14.846
-2.711
-15.44%
1 gen 2006 anni
15.626
+0.78
5.25%
1 gen 2007 anni
13.956
-1.67
-10.69%
1 gen 2008 anni
13.303
-0.653
-4.68%
1 gen 2009 anni
11.704
-1.599
-12.02%
1 gen 2010 anni
15.039
+3.336
28.5%
1 gen 2011 anni
11.418
-3.622
-24.08%
1 gen 2012 anni
17.864
+6.446
56.46%
1 gen 2013 anni
18.479
+0.615
3.44%
1 gen 2014 anni
18.537
+0.058
0.31%
1 gen 2015 anni
21.184
+2.647
14.28%
1 gen 2016 anni
22.557
+1.373
6.48%
Classificazione dei paesi secondo i statistiche attuali per anni


Commenti: