29
/it/
it
AIzaSyAYiBZKx7MnpbEhh9jyipgxe19OcubqV5w
April 1, 2024
140135
Ghana
GHA
true
2
1
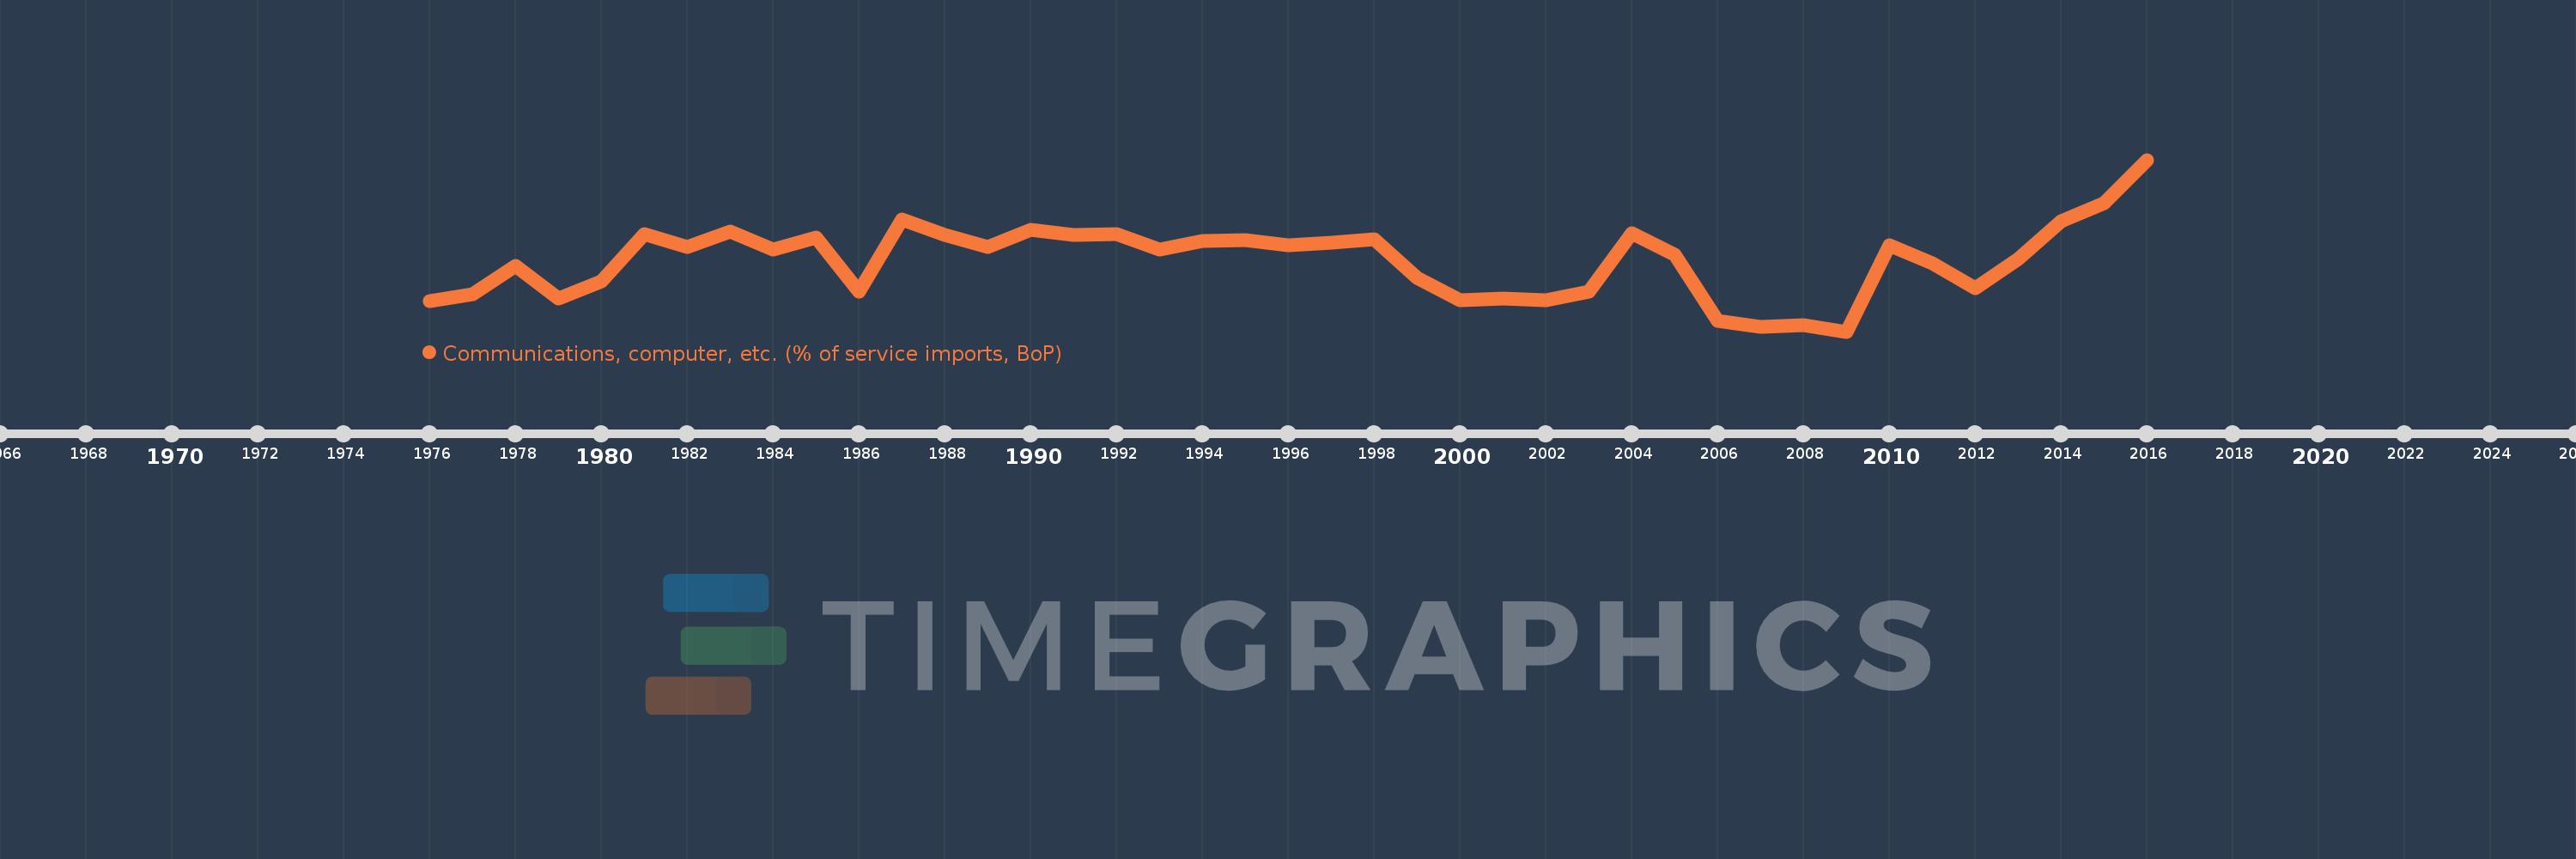
Communications, computer, etc. (% of service imports, BoP)
2016,2015,2014,2013,2012,2011,2010,2009,2008,2007,2006,2005,2004,2003,2002,2001,2000,1999,1998,1997,1996,1995,1994,1993,1992,1991,1990,1989,1988,1987,1986,1985,1984,1983,1982,1981,1980,1979,1978,1977,1976
Queste statistiche in altri paesi:
AfghanistanAlbaniaAlgeriaAngolaAntigua and BarbudaArab WorldArgentinaArmeniaArubaAustraliaAustriaAzerbaijanBahamas, TheBahrainBangladeshBarbadosBelarusBelgiumBelizeBeninBermudaBhutanBoliviaBosnia and HerzegovinaBotswanaBrazilBrunei DarussalamBulgariaBurkina FasoBurundiCabo VerdeCambodiaCameroonCanadaCaribbean small statesCentral African RepublicCentral Europe and the BalticsChadChileChinaColombiaComorosCongo, Dem. Rep.Congo, Rep.Costa RicaCote d'IvoireCroatiaCuracaoCyprusCzech RepublicDenmarkDjiboutiDominicaDominican RepublicEarly-demographic dividendEast Asia & PacificEast Asia & Pacific (excluding high income)East Asia & Pacific (IDA & IBRD countries)EcuadorEgypt, Arab Rep.El SalvadorEquatorial GuineaEritreaEstoniaEthiopiaEuro areaEurope & Central AsiaEurope & Central Asia (excluding high income)Europe & Central Asia (IDA & IBRD countries)European UnionFaroe IslandsFijiFinlandFragile and conflict affected situationsFranceFrench PolynesiaGabonGambia, TheGeorgiaGermanyGhanaGreeceGrenadaGuatemalaGuineaGuinea-BissauGuyanaHaitiHeavily indebted poor countries (HIPC)High incomeHondurasHong Kong SAR, ChinaHungaryIBRD onlyIcelandIDA & IBRD totalIDA onlyIDA totalIndiaIndonesiaIran, Islamic Rep.IraqIrelandIsraelItalyJamaicaJapanJordanKazakhstanKenyaKiribatiKorea, Rep.KosovoKuwaitKyrgyz RepublicLao PDRLate-demographic dividendLatin America & Caribbean Latin America & Caribbean (excluding high income)Latin America & the Caribbean (IDA & IBRD countries)LatviaLeast developed countries: UN classificationLebanonLesothoLiberiaLibyaLithuaniaLow & middle incomeLow incomeLower middle incomeLuxembourgMacao SAR, ChinaMacedonia, FYRMadagascarMalawiMalaysiaMaldivesMaliMaltaMarshall IslandsMauritaniaMauritiusMexicoMicronesia, Fed. Sts.Middle East & North AfricaMiddle East & North Africa (excluding high income)Middle East & North Africa (IDA & IBRD countries)Middle incomeMoldovaMongoliaMontenegroMoroccoMozambiqueMyanmarNamibiaNepalNetherlandsNew CaledoniaNew ZealandNicaraguaNigerNigeriaNorth AmericaNorwayOECD membersOmanOther small statesPacific island small statesPakistanPalauPanamaPapua New GuineaParaguayPeruPhilippinesPolandPortugalPost-demographic dividendPre-demographic dividendQatarRomaniaRussian FederationRwandaSamoaSao Tome and PrincipeSaudi ArabiaSenegalSerbiaSeychellesSierra LeoneSingaporeSint Maarten (Dutch part)Slovak RepublicSloveniaSmall statesSolomon IslandsSouth AfricaSouth AsiaSouth Asia (IDA & IBRD)South SudanSpainSri LankaSt. Kitts and NevisSt. LuciaSt. Vincent and the GrenadinesSub-Saharan Africa Sub-Saharan Africa (excluding high income)Sub-Saharan Africa (IDA & IBRD countries)SudanSurinameSwazilandSwedenSwitzerlandSyrian Arab RepublicTajikistanTanzaniaThailandTimor-LesteTogoTongaTrinidad and TobagoTunisiaTurkeyTuvaluUgandaUkraineUnited KingdomUnited StatesUpper middle incomeUruguayVanuatuVenezuela, RBWest Bank and GazaWorldYemen, Rep.ZambiaZimbabwe Linea del tempo:
Questa scala temporale mostra un grafico dal 1976 anno al 2016 anno. Ghana. I dati fino ad 1975 anno non disponibili. Il numero di osservazioni attuali secondo i date: 41.
La fonte (nome):
Indicatori dello sviluppo mondiale
La fonte (organizzazione):
International Monetary Fund, Balance of Payments Statistics Yearbook and data files.
Categorie:
Economy & Growth, Trade
sono stati aggiornati
23 apr 2017 anni
Indicatori delle variazioni dei valori per anni
Minima:
23.662
1 gen 2009 anni
Massimo:
62.834
1 gen 2016 anni
Alla data di osservazione
Valore
Variazione assoluta
La variazione rispetto al valore precedente
1 gen 1976 anni
30.598
+30.598
0.0%
1 gen 1977 anni
32.275
+1.677
5.48%
1 gen 1978 anni
38.574
+6.299
19.52%
1 gen 1979 anni
31.182
-7.392
-19.16%
1 gen 1980 anni
35.08
+3.898
12.5%
1 gen 1981 anni
45.832
+10.752
30.65%
1 gen 1982 anni
42.872
-2.96
-6.46%
1 gen 1983 anni
46.538
+3.666
8.55%
1 gen 1984 anni
42.316
-4.222
-9.07%
1 gen 1985 anni
45.153
+2.837
6.7%
1 gen 1986 anni
32.677
-12.476
-27.63%
1 gen 1987 anni
49.138
+16.461
50.37%
1 gen 1988 anni
45.71
-3.428
-6.98%
1 gen 1989 anni
43.022
-2.688
-5.88%
1 gen 1990 anni
46.865
+3.842
8.93%
1 gen 1991 anni
45.79
-1.074
-2.29%
1 gen 1992 anni
45.904
+0.114
0.25%
1 gen 1993 anni
42.441
-3.464
-7.55%
1 gen 1994 anni
44.24
+1.799
4.24%
1 gen 1995 anni
44.439
+0.199
0.45%
1 gen 1996 anni
43.271
-1.168
-2.63%
1 gen 1997 anni
43.95
+0.679
1.57%
1 gen 1998 anni
44.676
+0.726
1.65%
1 gen 1999 anni
35.94
-8.736
-19.55%
1 gen 2000 anni
30.759
-5.182
-14.42%
1 gen 2001 anni
31.119
+0.36
1.17%
1 gen 2002 anni
30.72
-0.399
-1.28%
1 gen 2003 anni
32.797
+2.077
6.76%
1 gen 2004 anni
46.123
+13.325
40.63%
1 gen 2005 anni
41.275
-4.848
-10.51%
1 gen 2006 anni
26.084
-15.191
-36.8%
1 gen 2007 anni
24.711
-1.373
-5.26%
1 gen 2008 anni
25.164
+0.452
1.83%
1 gen 2009 anni
23.662
-1.502
-5.97%
1 gen 2010 anni
43.379
+19.718
83.33%
1 gen 2011 anni
39.176
-4.203
-9.69%
1 gen 2012 anni
33.569
-5.607
-14.31%
1 gen 2013 anni
40.153
+6.584
19.61%
1 gen 2014 anni
48.745
+8.591
21.4%
1 gen 2015 anni
52.881
+4.137
8.49%
1 gen 2016 anni
62.834
+9.953
18.82%
Classificazione dei paesi secondo i statistiche attuali per anni


Commenti: