29
/it/
it
AIzaSyAYiBZKx7MnpbEhh9jyipgxe19OcubqV5w
April 1, 2024
215675
Oman
OMN
true
2
1
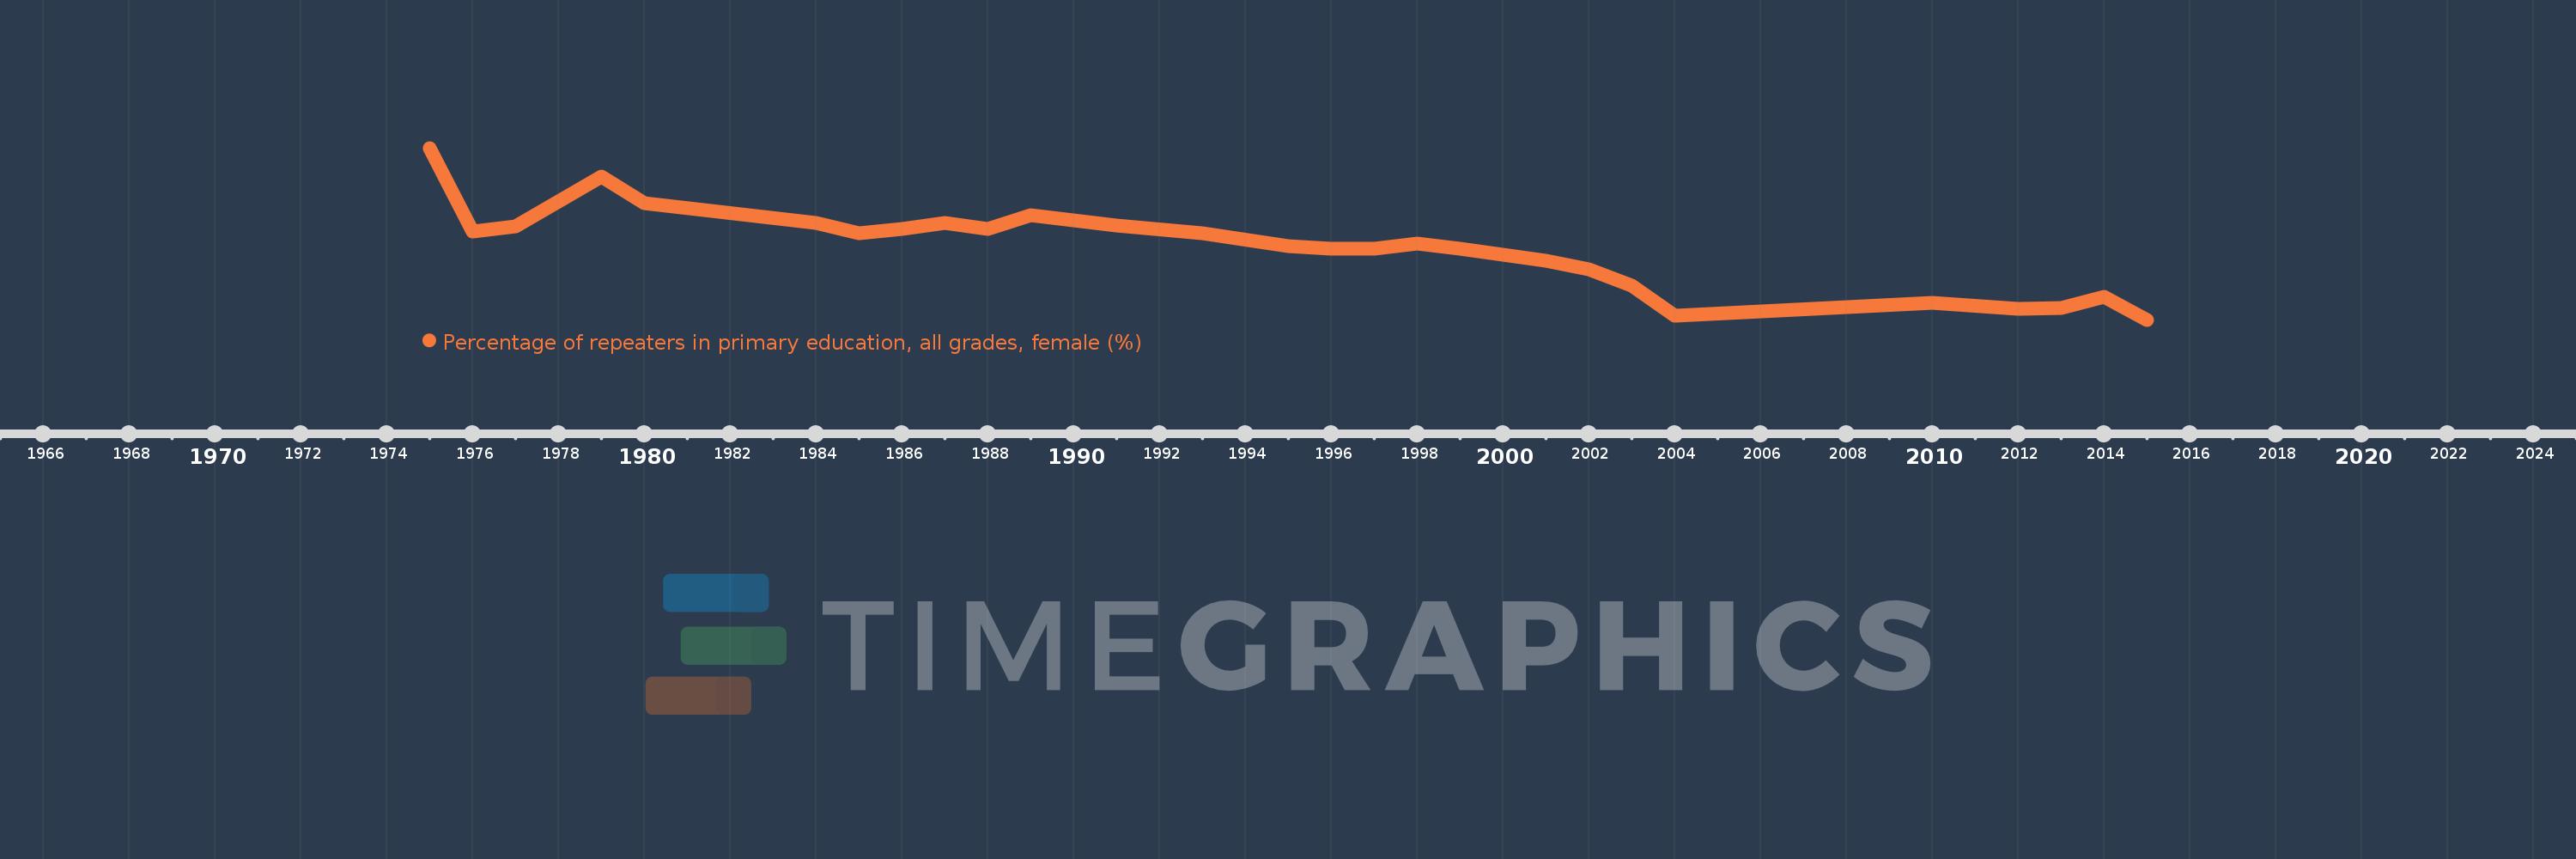
Percentage of repeaters in primary education, all grades, female (%)
2015,2014,2013,2012,2010,2004,2003,2002,2001,2000,1999,1998,1997,1996,1995,1993,1991,1990,1989,1988,1987,1986,1985,1984,1980,1979,1977,1976,1975
Queste statistiche in altri paesi:
AfghanistanAlbaniaAlgeriaAndorraAngolaAntigua and BarbudaArab WorldArgentinaArmeniaArubaAustriaAzerbaijanBahamas, TheBahrainBangladeshBelarusBelgiumBelizeBeninBermudaBhutanBoliviaBosnia and HerzegovinaBotswanaBrazilBritish Virgin IslandsBrunei DarussalamBulgariaBurkina FasoBurundiCabo VerdeCambodiaCameroonCanadaCaribbean small statesCayman IslandsCentral African RepublicCentral Europe and the BalticsChadChileChinaColombiaComorosCongo, Dem. Rep.Congo, Rep.Costa RicaCote d'IvoireCroatiaCubaCyprusCzech RepublicDenmarkDjiboutiDominicaDominican RepublicEarly-demographic dividendEast Asia & PacificEast Asia & Pacific (excluding high income)East Asia & Pacific (IDA & IBRD countries)EcuadorEgypt, Arab Rep.El SalvadorEquatorial GuineaEritreaEstoniaEthiopiaEuro areaEurope & Central AsiaEurope & Central Asia (excluding high income)Europe & Central Asia (IDA & IBRD countries)European UnionFijiFinlandFragile and conflict affected situationsFranceGabonGambia, TheGeorgiaGermanyGhanaGreeceGrenadaGuatemalaGuineaGuinea-BissauGuyanaHaitiHeavily indebted poor countries (HIPC)High incomeHondurasHong Kong SAR, ChinaHungaryIBRD onlyIcelandIDA & IBRD totalIDA blendIDA onlyIDA totalIndiaIndonesiaIran, Islamic Rep.IraqIrelandIsraelItalyJamaicaJapanJordanKazakhstanKenyaKiribatiKorea, Rep.KuwaitKyrgyz RepublicLao PDRLate-demographic dividendLatin America & Caribbean Latin America & Caribbean (excluding high income)Latin America & the Caribbean (IDA & IBRD countries)LatviaLeast developed countries: UN classificationLebanonLesothoLiberiaLibyaLiechtensteinLithuaniaLow & middle incomeLow incomeLower middle incomeLuxembourgMacao SAR, ChinaMacedonia, FYRMadagascarMalawiMalaysiaMaldivesMaliMaltaMauritaniaMauritiusMexicoMiddle East & North AfricaMiddle East & North Africa (excluding high income)Middle East & North Africa (IDA & IBRD countries)Middle incomeMoldovaMonacoMongoliaMontenegroMoroccoMozambiqueMyanmarNamibiaNauruNepalNetherlandsNew ZealandNicaraguaNigerNorwayOECD membersOmanOther small statesPacific island small statesPakistanPalauPanamaPapua New GuineaParaguayPeruPhilippinesPolandPortugalPost-demographic dividendPre-demographic dividendQatarRomaniaRussian FederationRwandaSamoaSan MarinoSao Tome and PrincipeSaudi ArabiaSenegalSerbiaSeychellesSierra LeoneSingaporeSint Maarten (Dutch part)Slovak RepublicSloveniaSmall statesSolomon IslandsSomaliaSouth AfricaSouth AsiaSouth Asia (IDA & IBRD)South SudanSpainSri LankaSt. Kitts and NevisSt. LuciaSt. Vincent and the GrenadinesSub-Saharan Africa Sub-Saharan Africa (excluding high income)Sub-Saharan Africa (IDA & IBRD countries)SudanSurinameSwazilandSwedenSwitzerlandSyrian Arab RepublicTajikistanTanzaniaThailandTimor-LesteTogoTongaTrinidad and TobagoTunisiaTurkeyTurks and Caicos IslandsTuvaluUgandaUkraineUnited Arab EmiratesUnited KingdomUpper middle incomeUruguayUzbekistanVanuatuVenezuela, RBVietnamWest Bank and GazaWorldYemen, Rep.ZambiaZimbabwe Linea del tempo:
Questa scala temporale mostra un grafico dal 1975 anno al 2015 anno. Oman. I dati fino ad 1974 anno non disponibili. Il numero di osservazioni attuali secondo i date: 29.
La fonte (nome):
Indicatori dello sviluppo mondiale
La fonte (organizzazione):
UNESCO Institute for Statistics
Categorie:
Education, Gender
sono stati aggiornati
23 apr 2017 anni
Indicatori delle variazioni dei valori per anni
Minima:
0.0
1 gen 2015 anni
Massimo:
16.767
1 gen 1975 anni
Alla data di osservazione
Valore
Variazione assoluta
La variazione rispetto al valore precedente
1 gen 1975 anni
16.767
+16.767
0.0%
1 gen 1976 anni
8.593
-8.174
-48.75%
1 gen 1977 anni
9.073
+0.48
5.59%
1 gen 1979 anni
14.005
+4.932
54.35%
1 gen 1980 anni
11.348
-2.657
-18.97%
1 gen 1984 anni
9.43
-1.918
-16.9%
1 gen 1985 anni
8.464
-0.966
-10.24%
1 gen 1986 anni
8.89
+0.427
5.04%
1 gen 1987 anni
9.488
+0.598
6.72%
1 gen 1988 anni
8.825
-0.663
-6.99%
1 gen 1989 anni
10.228
+1.402
15.89%
1 gen 1990 anni
9.69
-0.538
-5.26%
1 gen 1991 anni
9.225
-0.465
-4.8%
1 gen 1993 anni
8.411
-0.815
-8.83%
1 gen 1995 anni
7.21
-1.201
-14.28%
1 gen 1996 anni
6.895
-0.315
-4.36%
1 gen 1997 anni
6.934
+0.039
0.56%
1 gen 1998 anni
7.459
+0.525
7.57%
1 gen 1999 anni
6.967
-0.492
-6.6%
1 gen 2000 anni
6.378
-0.588
-8.44%
1 gen 2001 anni
5.794
-0.585
-9.17%
1 gen 2002 anni
4.884
-0.91
-15.7%
1 gen 2003 anni
3.296
-1.588
-32.51%
1 gen 2004 anni
0.416
-2.88
-87.37%
1 gen 2010 anni
1.628
+1.212
290.95%
1 gen 2012 anni
1.025
-0.603
-37.04%
1 gen 2013 anni
1.132
+0.107
10.44%
1 gen 2014 anni
2.232
+1.1
97.18%
1 gen 2015 anni
0.0
-2.232
-100.0%
Classificazione dei paesi secondo i statistiche attuali per anni


Commenti: