29
/it/
it
AIzaSyAYiBZKx7MnpbEhh9jyipgxe19OcubqV5w
April 1, 2024
140860
Ghana
GHA
true
2
1
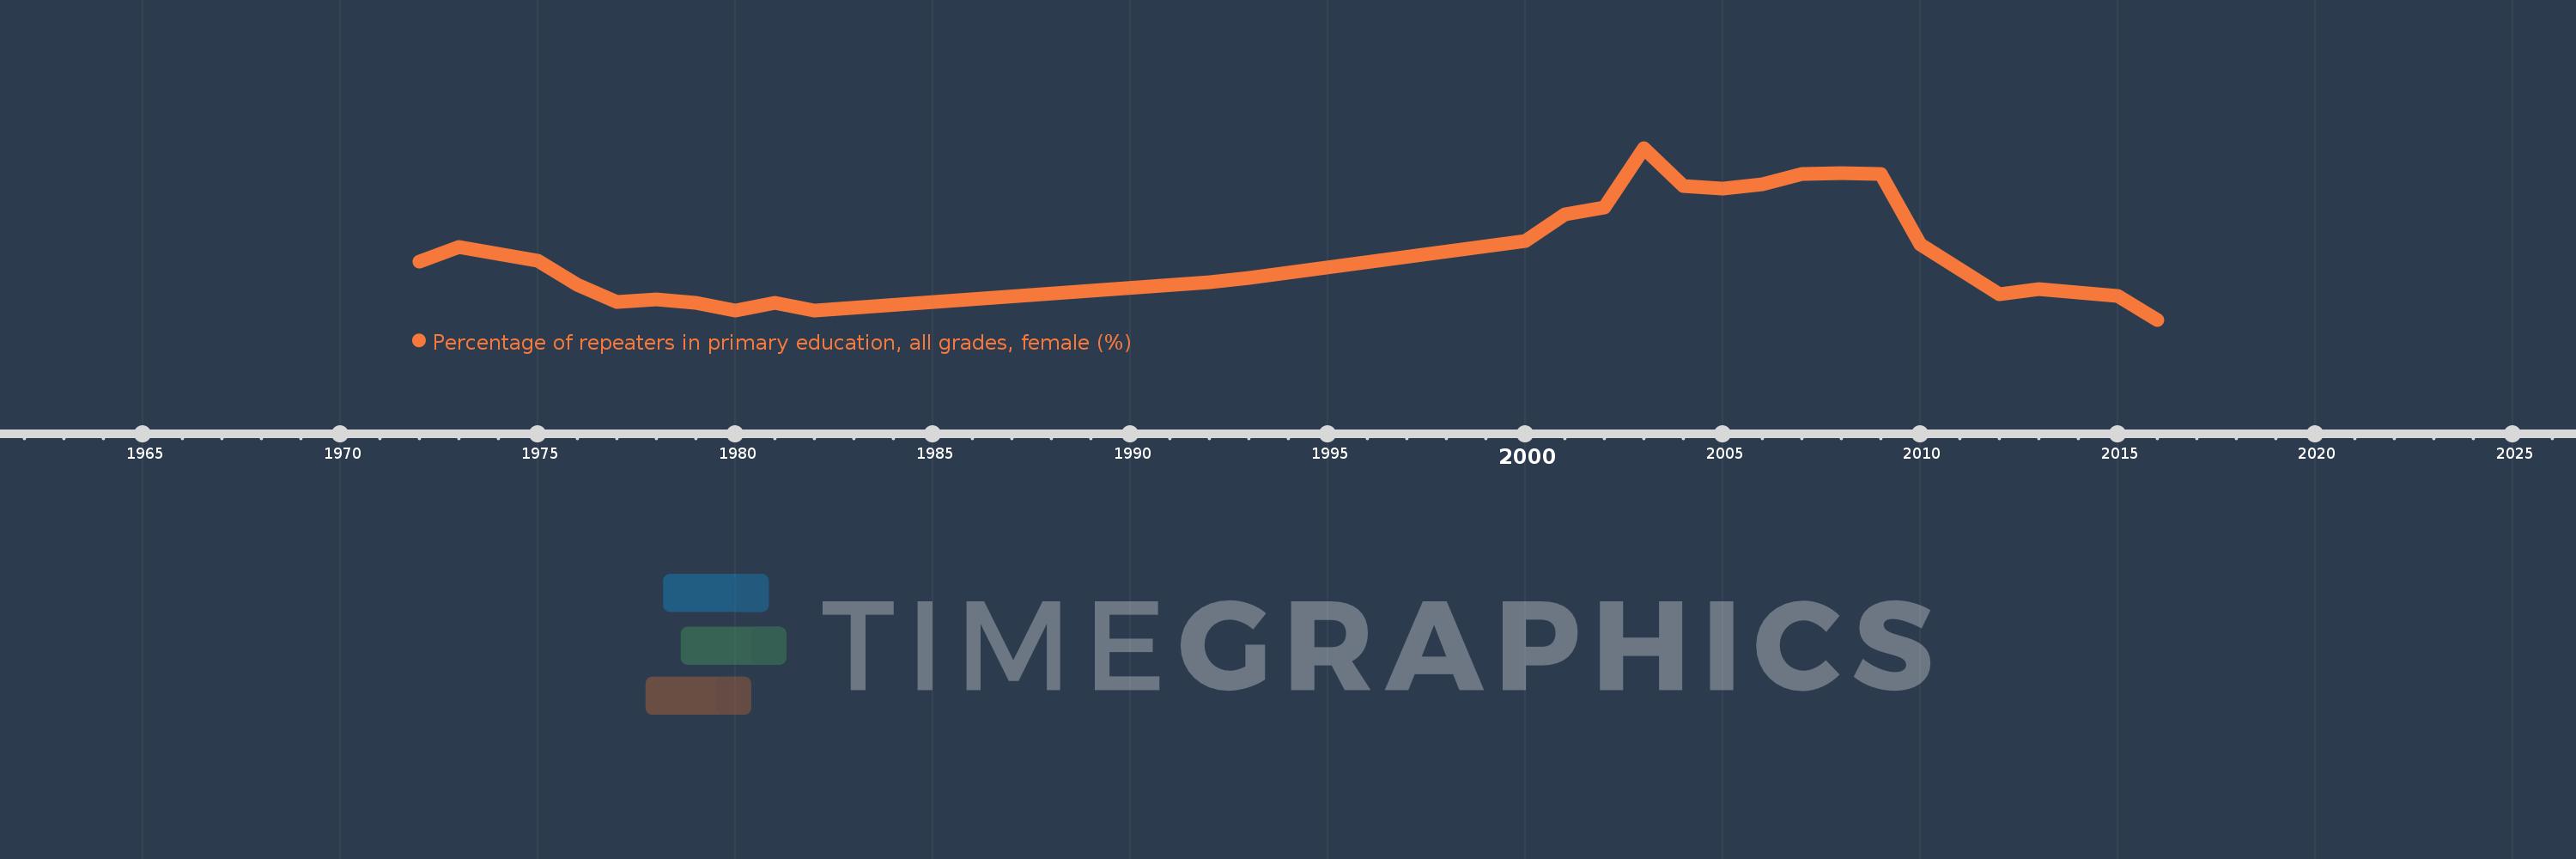
Percentage of repeaters in primary education, all grades, female (%)
2016,2015,2013,2012,2010,2009,2008,2007,2006,2005,2004,2003,2002,2001,2000,1993,1992,1982,1981,1980,1979,1978,1977,1976,1975,1973,1972
Queste statistiche in altri paesi:
AfghanistanAlbaniaAlgeriaAndorraAngolaAntigua and BarbudaArab WorldArgentinaArmeniaArubaAustriaAzerbaijanBahamas, TheBahrainBangladeshBelarusBelgiumBelizeBeninBermudaBhutanBoliviaBosnia and HerzegovinaBotswanaBrazilBritish Virgin IslandsBrunei DarussalamBulgariaBurkina FasoBurundiCabo VerdeCambodiaCameroonCanadaCaribbean small statesCayman IslandsCentral African RepublicCentral Europe and the BalticsChadChileChinaColombiaComorosCongo, Dem. Rep.Congo, Rep.Costa RicaCote d'IvoireCroatiaCubaCyprusCzech RepublicDenmarkDjiboutiDominicaDominican RepublicEarly-demographic dividendEast Asia & PacificEast Asia & Pacific (excluding high income)East Asia & Pacific (IDA & IBRD countries)EcuadorEgypt, Arab Rep.El SalvadorEquatorial GuineaEritreaEstoniaEthiopiaEuro areaEurope & Central AsiaEurope & Central Asia (excluding high income)Europe & Central Asia (IDA & IBRD countries)European UnionFijiFinlandFragile and conflict affected situationsFranceGabonGambia, TheGeorgiaGermanyGhanaGreeceGrenadaGuatemalaGuineaGuinea-BissauGuyanaHaitiHeavily indebted poor countries (HIPC)High incomeHondurasHong Kong SAR, ChinaHungaryIBRD onlyIcelandIDA & IBRD totalIDA blendIDA onlyIDA totalIndiaIndonesiaIran, Islamic Rep.IraqIrelandIsraelItalyJamaicaJapanJordanKazakhstanKenyaKiribatiKorea, Rep.KuwaitKyrgyz RepublicLao PDRLate-demographic dividendLatin America & Caribbean Latin America & Caribbean (excluding high income)Latin America & the Caribbean (IDA & IBRD countries)LatviaLeast developed countries: UN classificationLebanonLesothoLiberiaLibyaLiechtensteinLithuaniaLow & middle incomeLow incomeLower middle incomeLuxembourgMacao SAR, ChinaMacedonia, FYRMadagascarMalawiMalaysiaMaldivesMaliMaltaMauritaniaMauritiusMexicoMiddle East & North AfricaMiddle East & North Africa (excluding high income)Middle East & North Africa (IDA & IBRD countries)Middle incomeMoldovaMonacoMongoliaMontenegroMoroccoMozambiqueMyanmarNamibiaNauruNepalNetherlandsNew ZealandNicaraguaNigerNorwayOECD membersOmanOther small statesPacific island small statesPakistanPalauPanamaPapua New GuineaParaguayPeruPhilippinesPolandPortugalPost-demographic dividendPre-demographic dividendQatarRomaniaRussian FederationRwandaSamoaSan MarinoSao Tome and PrincipeSaudi ArabiaSenegalSerbiaSeychellesSierra LeoneSingaporeSint Maarten (Dutch part)Slovak RepublicSloveniaSmall statesSolomon IslandsSomaliaSouth AfricaSouth AsiaSouth Asia (IDA & IBRD)South SudanSpainSri LankaSt. Kitts and NevisSt. LuciaSt. Vincent and the GrenadinesSub-Saharan Africa Sub-Saharan Africa (excluding high income)Sub-Saharan Africa (IDA & IBRD countries)SudanSurinameSwazilandSwedenSwitzerlandSyrian Arab RepublicTajikistanTanzaniaThailandTimor-LesteTogoTongaTrinidad and TobagoTunisiaTurkeyTurks and Caicos IslandsTuvaluUgandaUkraineUnited Arab EmiratesUnited KingdomUpper middle incomeUruguayUzbekistanVanuatuVenezuela, RBVietnamWest Bank and GazaWorldYemen, Rep.ZambiaZimbabwe Linea del tempo:
Questa scala temporale mostra un grafico dal 1972 anno al 2016 anno. Ghana. I dati fino ad 1971 anno non disponibili. Il numero di osservazioni attuali secondo i date: 27.
La fonte (nome):
Indicatori dello sviluppo mondiale
La fonte (organizzazione):
UNESCO Institute for Statistics
Categorie:
Education, Gender
sono stati aggiornati
23 apr 2017 anni
Indicatori delle variazioni dei valori per anni
Minima:
1.911
1 gen 2016 anni
Massimo:
6.688
1 gen 2003 anni
Alla data di osservazione
Valore
Variazione assoluta
La variazione rispetto al valore precedente
1 gen 1972 anni
3.529
+3.529
0.0%
1 gen 1973 anni
3.925
+0.395
11.2%
1 gen 1975 anni
3.55
-0.374
-9.54%
1 gen 1976 anni
2.882
-0.668
-18.81%
1 gen 1977 anni
2.409
-0.473
-16.42%
1 gen 1978 anni
2.472
+0.063
2.62%
1 gen 1979 anni
2.382
-0.09
-3.65%
1 gen 1980 anni
2.172
-0.21
-8.81%
1 gen 1981 anni
2.388
+0.215
9.91%
1 gen 1982 anni
2.175
-0.212
-8.88%
1 gen 1992 anni
2.952
+0.777
35.71%
1 gen 1993 anni
3.078
+0.125
4.25%
1 gen 2000 anni
4.105
+1.027
33.38%
1 gen 2001 anni
4.845
+0.739
18.01%
1 gen 2002 anni
5.044
+0.199
4.11%
1 gen 2003 anni
6.688
+1.644
32.59%
1 gen 2004 anni
5.637
-1.051
-15.71%
1 gen 2005 anni
5.559
-0.078
-1.38%
1 gen 2006 anni
5.676
+0.117
2.1%
1 gen 2007 anni
5.956
+0.28
4.94%
1 gen 2008 anni
5.987
+0.03
0.51%
1 gen 2009 anni
5.971
-0.016
-0.26%
1 gen 2010 anni
4.001
-1.97
-33.0%
1 gen 2012 anni
2.627
-1.374
-34.34%
1 gen 2013 anni
2.775
+0.147
5.61%
1 gen 2015 anni
2.566
-0.209
-7.52%
1 gen 2016 anni
1.911
-0.655
-25.53%
Classificazione dei paesi secondo i statistiche attuali per anni


Commenti: