29
/it/
it
AIzaSyAYiBZKx7MnpbEhh9jyipgxe19OcubqV5w
April 1, 2024
214857
Norway
NOR
true
2
1
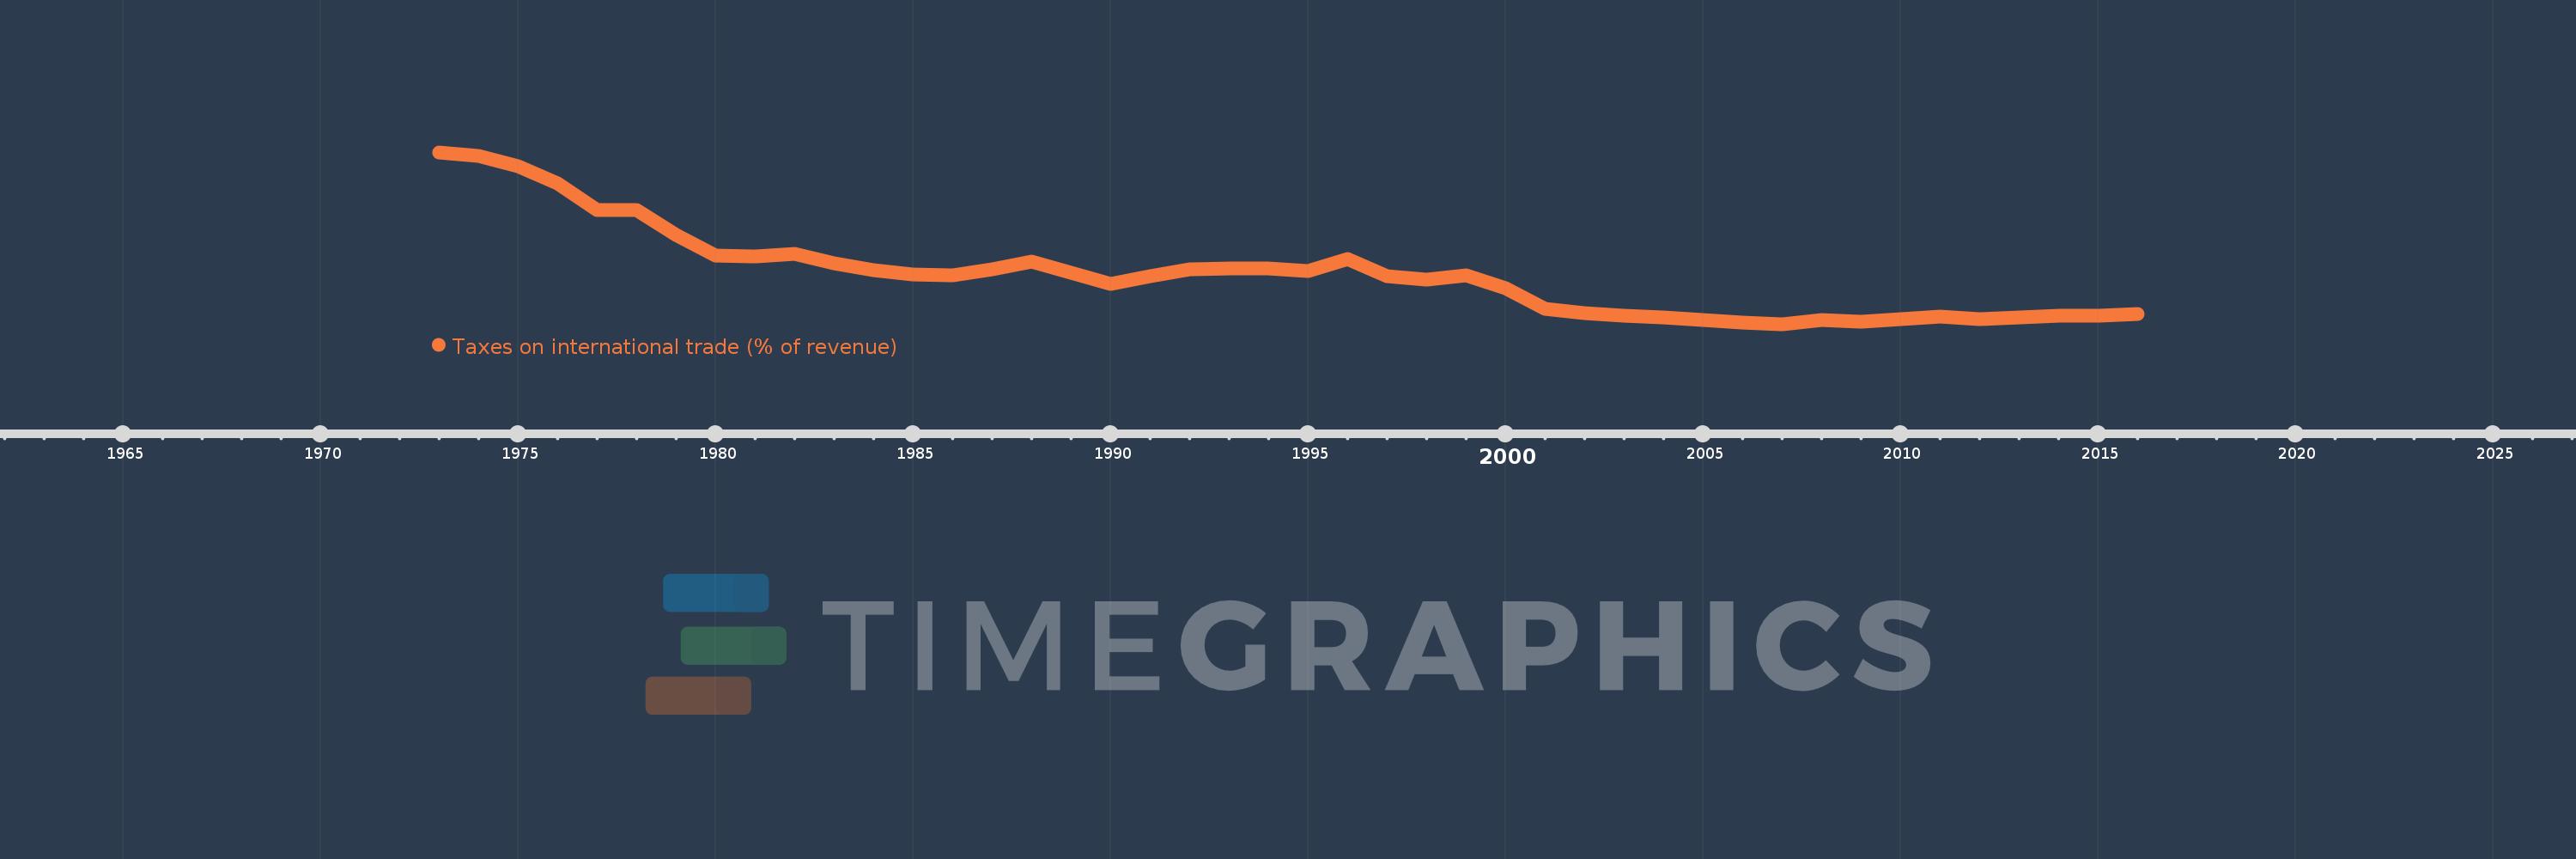
Taxes on international trade (% of revenue)
2016,2015,2014,2013,2012,2011,2010,2009,2008,2007,2006,2005,2004,2003,2002,2001,2000,1999,1998,1997,1996,1995,1994,1993,1992,1991,1990,1989,1988,1987,1986,1985,1984,1983,1982,1981,1980,1979,1978,1977,1976,1975,1974,1973
Queste statistiche in altri paesi:
AfghanistanAlbaniaAlgeriaAngolaAntigua and BarbudaArab WorldArgentinaArmeniaAustraliaAustriaAzerbaijanBahamas, TheBahrainBangladeshBarbadosBelarusBelizeBeninBhutanBoliviaBosnia and HerzegovinaBotswanaBrazilBulgariaBurkina FasoBurundiCabo VerdeCambodiaCanadaCaribbean small statesCentral African RepublicCentral Europe and the BalticsChileChinaColombiaCongo, Dem. Rep.Congo, Rep.Costa RicaCote d'IvoireCroatiaCyprusCzech RepublicDenmarkDominicaDominican RepublicEarly-demographic dividendEast Asia & PacificEast Asia & Pacific (excluding high income)East Asia & Pacific (IDA & IBRD countries)Egypt, Arab Rep.El SalvadorEquatorial GuineaEstoniaEthiopiaEuro areaEurope & Central AsiaEurope & Central Asia (excluding high income)Europe & Central Asia (IDA & IBRD countries)European UnionFijiFinlandFranceGambia, TheGeorgiaGermanyGhanaGreeceGrenadaGuatemalaHeavily indebted poor countries (HIPC)High incomeHondurasHong Kong SAR, ChinaHungaryIBRD onlyIcelandIDA & IBRD totalIDA blendIDA onlyIDA totalIndiaIndonesiaIran, Islamic Rep.IraqIrelandIsraelItalyJamaicaJapanJordanKazakhstanKenyaKiribatiKorea, Rep.KuwaitKyrgyz RepublicLao PDRLate-demographic dividendLatin America & Caribbean Latin America & Caribbean (excluding high income)Latin America & the Caribbean (IDA & IBRD countries)LatviaLeast developed countries: UN classificationLebanonLesothoLiberiaLithuaniaLow & middle incomeLow incomeLower middle incomeLuxembourgMacedonia, FYRMadagascarMalawiMalaysiaMaldivesMaliMaltaMauritiusMexicoMicronesia, Fed. Sts.Middle East & North AfricaMiddle East & North Africa (excluding high income)Middle East & North Africa (IDA & IBRD countries)Middle incomeMoldovaMongoliaMoroccoMozambiqueMyanmarNamibiaNepalNetherlandsNew ZealandNicaraguaNorth AmericaNorwayOECD membersOmanOther small statesPakistanPanamaPapua New GuineaParaguayPeruPhilippinesPolandPortugalPost-demographic dividendPre-demographic dividendQatarRomaniaRussian FederationRwandaSamoaSan MarinoSao Tome and PrincipeSenegalSerbiaSeychellesSierra LeoneSingaporeSlovak RepublicSloveniaSmall statesSolomon IslandsSouth AfricaSouth AsiaSouth Asia (IDA & IBRD)SpainSri LankaSt. Kitts and NevisSt. LuciaSub-Saharan Africa Sub-Saharan Africa (excluding high income)Sub-Saharan Africa (IDA & IBRD countries)SurinameSwazilandSwedenSwitzerlandSyrian Arab RepublicTajikistanTanzaniaThailandTimor-LesteTogoTrinidad and TobagoTunisiaTurkeyUgandaUkraineUnited Arab EmiratesUnited KingdomUnited StatesUpper middle incomeUruguayVanuatuVenezuela, RBVietnamWest Bank and GazaWorldYemen, Rep.ZambiaZimbabwe Linea del tempo:
Questa scala temporale mostra un grafico dal 1973 anno al 2016 anno. Norway. I dati fino ad 1972 anno non disponibili. Il numero di osservazioni attuali secondo i date: 44.
La fonte (nome):
Indicatori dello sviluppo mondiale
La fonte (organizzazione):
International Monetary Fund, Government Finance Statistics Yearbook and data files.
Categorie:
Public Sector
sono stati aggiornati
23 apr 2017 anni
Indicatori delle variazioni dei valori per anni
Minima:
0.147
1 gen 2007 anni
Massimo:
1.508
1 gen 1973 anni
Alla data di osservazione
Valore
Variazione assoluta
La variazione rispetto al valore precedente
1 gen 1973 anni
1.508
+1.508
0.0%
1 gen 1974 anni
1.478
-0.031
-2.05%
1 gen 1975 anni
1.401
-0.076
-5.16%
1 gen 1976 anni
1.263
-0.138
-9.86%
1 gen 1977 anni
1.048
-0.215
-17.03%
1 gen 1978 anni
1.052
+0.004
0.38%
1 gen 1979 anni
0.853
-0.199
-18.96%
1 gen 1980 anni
0.69
-0.162
-19.06%
1 gen 1981 anni
0.682
-0.008
-1.16%
1 gen 1982 anni
0.707
+0.025
3.61%
1 gen 1983 anni
0.629
-0.078
-10.97%
1 gen 1984 anni
0.573
-0.056
-8.97%
1 gen 1985 anni
0.543
-0.03
-5.24%
1 gen 1986 anni
0.531
-0.012
-2.21%
1 gen 1987 anni
0.585
+0.054
10.13%
1 gen 1988 anni
0.645
+0.06
10.33%
1 gen 1989 anni
0.557
-0.088
-13.68%
1 gen 1990 anni
0.467
-0.09
-16.15%
1 gen 1991 anni
0.525
+0.058
12.37%
1 gen 1992 anni
0.582
+0.057
10.9%
1 gen 1993 anni
0.588
+0.006
1.11%
1 gen 1994 anni
0.592
+0.004
0.62%
1 gen 1995 anni
0.569
-0.023
-3.88%
1 gen 1996 anni
0.665
+0.096
16.93%
1 gen 1997 anni
0.525
-0.14
-21.09%
1 gen 1998 anni
0.498
-0.027
-5.19%
1 gen 1999 anni
0.532
+0.034
6.89%
1 gen 2000 anni
0.433
-0.099
-18.59%
1 gen 2001 anni
0.267
-0.166
-38.4%
1 gen 2002 anni
0.238
-0.029
-10.76%
1 gen 2003 anni
0.214
-0.024
-10.15%
1 gen 2004 anni
0.202
-0.012
-5.63%
1 gen 2005 anni
0.179
-0.023
-11.32%
1 gen 2006 anni
0.16
-0.019
-10.62%
1 gen 2007 anni
0.147
-0.013
-7.91%
1 gen 2008 anni
0.182
+0.035
23.63%
1 gen 2009 anni
0.166
-0.016
-8.88%
1 gen 2010 anni
0.184
+0.018
11.07%
1 gen 2011 anni
0.206
+0.022
11.94%
1 gen 2012 anni
0.189
-0.017
-8.28%
1 gen 2013 anni
0.2
+0.01
5.48%
1 gen 2014 anni
0.211
+0.012
5.9%
1 gen 2015 anni
0.217
+0.005
2.56%
1 gen 2016 anni
0.23
+0.014
6.24%
Classificazione dei paesi secondo i statistiche attuali per anni


Commenti: