29
/it/
it
AIzaSyAYiBZKx7MnpbEhh9jyipgxe19OcubqV5w
April 1, 2024
133691
Finland
FIN
true
2
1
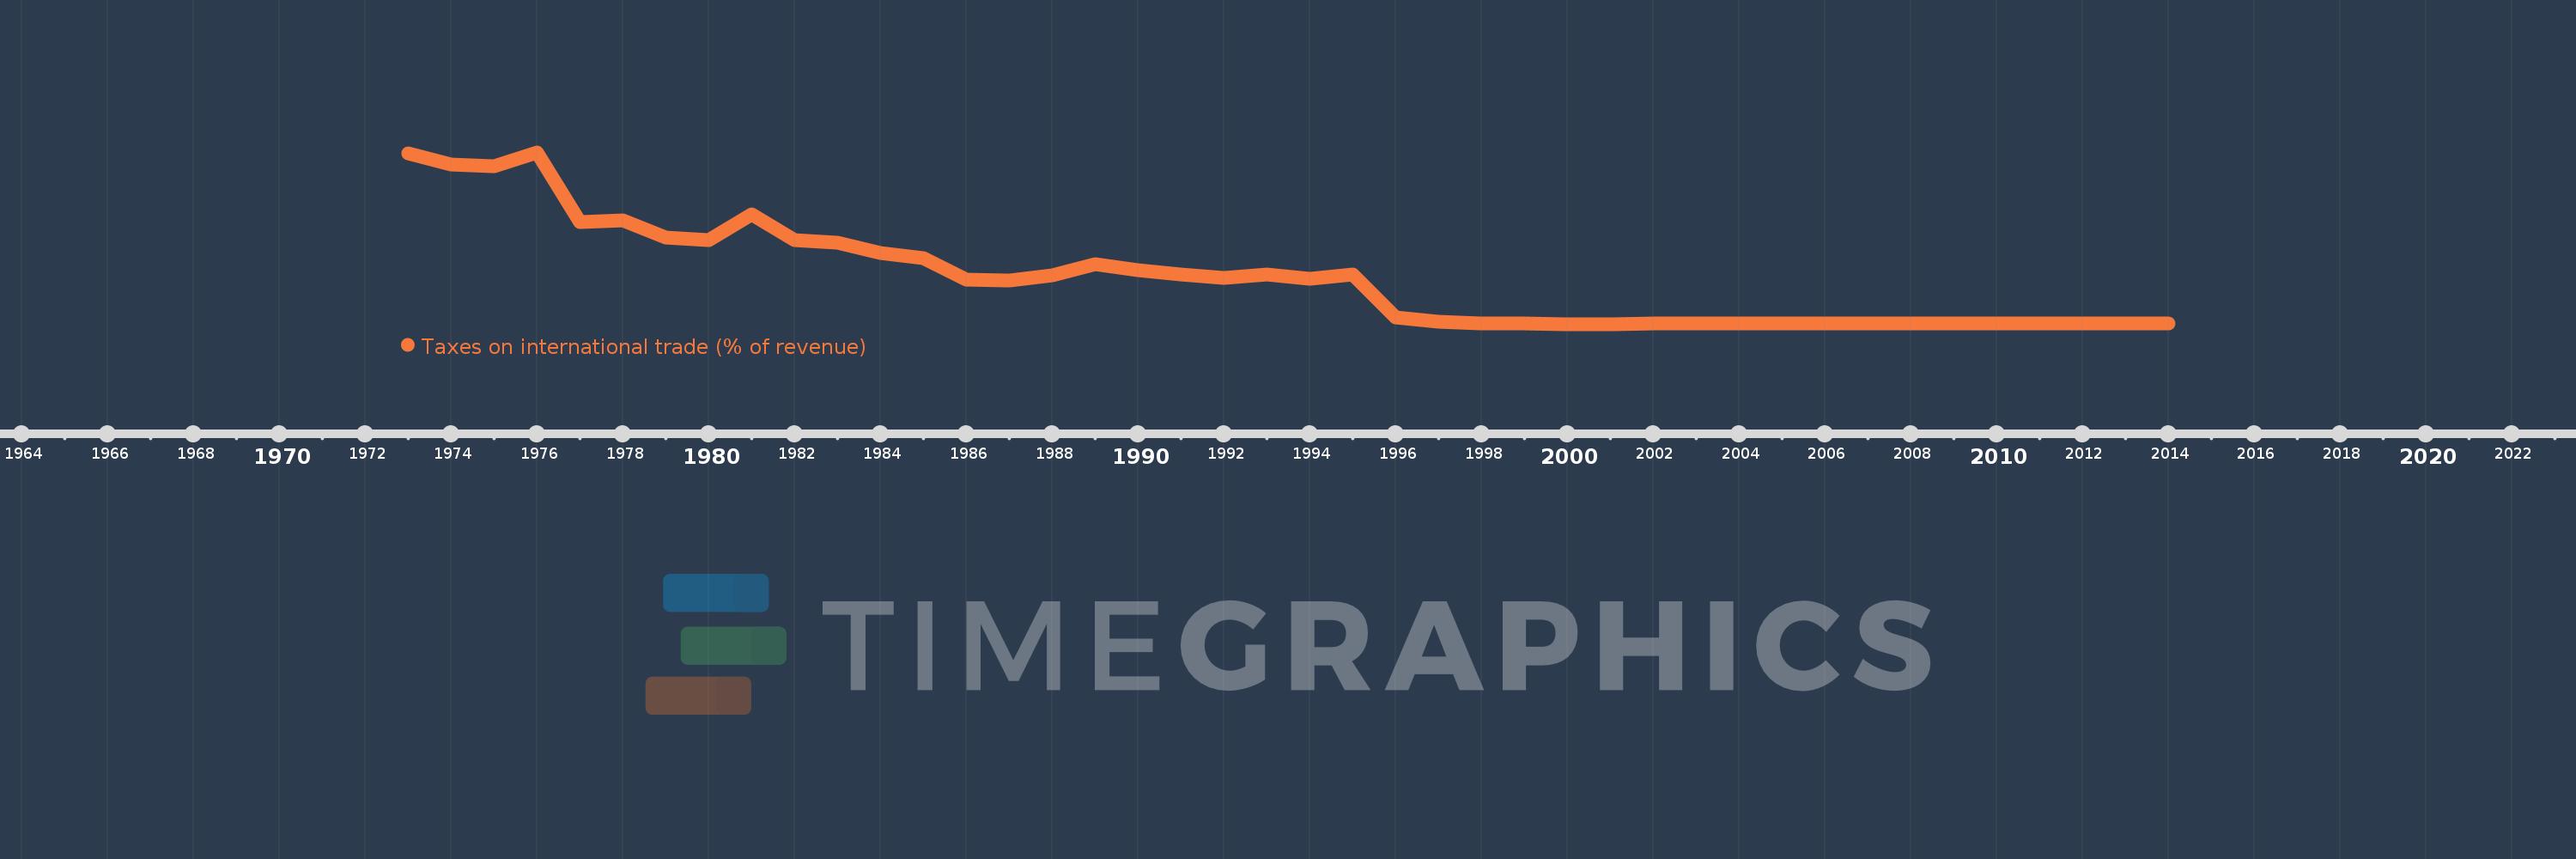
Taxes on international trade (% of revenue)
2014,2006,2005,2004,2002,2001,2000,1999,1998,1997,1996,1995,1994,1993,1992,1991,1990,1989,1988,1987,1986,1985,1984,1983,1982,1981,1980,1979,1978,1977,1976,1975,1974,1973
Queste statistiche in altri paesi:
AfghanistanAlbaniaAlgeriaAngolaAntigua and BarbudaArab WorldArgentinaArmeniaAustraliaAustriaAzerbaijanBahamas, TheBahrainBangladeshBarbadosBelarusBelizeBeninBhutanBoliviaBosnia and HerzegovinaBotswanaBrazilBulgariaBurkina FasoBurundiCabo VerdeCambodiaCanadaCaribbean small statesCentral African RepublicCentral Europe and the BalticsChileChinaColombiaCongo, Dem. Rep.Congo, Rep.Costa RicaCote d'IvoireCroatiaCyprusCzech RepublicDenmarkDominicaDominican RepublicEarly-demographic dividendEast Asia & PacificEast Asia & Pacific (excluding high income)East Asia & Pacific (IDA & IBRD countries)Egypt, Arab Rep.El SalvadorEquatorial GuineaEstoniaEthiopiaEuro areaEurope & Central AsiaEurope & Central Asia (excluding high income)Europe & Central Asia (IDA & IBRD countries)European UnionFijiFinlandFranceGambia, TheGeorgiaGermanyGhanaGreeceGrenadaGuatemalaHeavily indebted poor countries (HIPC)High incomeHondurasHong Kong SAR, ChinaHungaryIBRD onlyIcelandIDA & IBRD totalIDA blendIDA onlyIDA totalIndiaIndonesiaIran, Islamic Rep.IraqIrelandIsraelItalyJamaicaJapanJordanKazakhstanKenyaKiribatiKorea, Rep.KuwaitKyrgyz RepublicLao PDRLate-demographic dividendLatin America & Caribbean Latin America & Caribbean (excluding high income)Latin America & the Caribbean (IDA & IBRD countries)LatviaLeast developed countries: UN classificationLebanonLesothoLiberiaLithuaniaLow & middle incomeLow incomeLower middle incomeLuxembourgMacedonia, FYRMadagascarMalawiMalaysiaMaldivesMaliMaltaMauritiusMexicoMicronesia, Fed. Sts.Middle East & North AfricaMiddle East & North Africa (excluding high income)Middle East & North Africa (IDA & IBRD countries)Middle incomeMoldovaMongoliaMoroccoMozambiqueMyanmarNamibiaNepalNetherlandsNew ZealandNicaraguaNorth AmericaNorwayOECD membersOmanOther small statesPakistanPanamaPapua New GuineaParaguayPeruPhilippinesPolandPortugalPost-demographic dividendPre-demographic dividendQatarRomaniaRussian FederationRwandaSamoaSan MarinoSao Tome and PrincipeSenegalSerbiaSeychellesSierra LeoneSingaporeSlovak RepublicSloveniaSmall statesSolomon IslandsSouth AfricaSouth AsiaSouth Asia (IDA & IBRD)SpainSri LankaSt. Kitts and NevisSt. LuciaSub-Saharan Africa Sub-Saharan Africa (excluding high income)Sub-Saharan Africa (IDA & IBRD countries)SurinameSwazilandSwedenSwitzerlandSyrian Arab RepublicTajikistanTanzaniaThailandTimor-LesteTogoTrinidad and TobagoTunisiaTurkeyUgandaUkraineUnited Arab EmiratesUnited KingdomUnited StatesUpper middle incomeUruguayVanuatuVenezuela, RBVietnamWest Bank and GazaWorldYemen, Rep.ZambiaZimbabwe Linea del tempo:
Questa scala temporale mostra un grafico dal 1973 anno al 2014 anno. Finland. I dati fino ad 1972 anno non disponibili. Il numero di osservazioni attuali secondo i date: 34.
La fonte (nome):
Indicatori dello sviluppo mondiale
La fonte (organizzazione):
International Monetary Fund, Government Finance Statistics Yearbook and data files.
Categorie:
Public Sector
sono stati aggiornati
23 apr 2017 anni
Indicatori delle variazioni dei valori per anni
Minima:
-0.015
1 gen 2001 anni
Massimo:
3.092
1 gen 1976 anni
Alla data di osservazione
Valore
Variazione assoluta
La variazione rispetto al valore precedente
1 gen 1973 anni
3.069
+3.069
0.0%
1 gen 1974 anni
2.875
-0.194
-6.31%
1 gen 1975 anni
2.837
-0.038
-1.34%
1 gen 1976 anni
3.092
+0.255
8.97%
1 gen 1977 anni
1.837
-1.255
-40.59%
1 gen 1978 anni
1.864
+0.027
1.46%
1 gen 1979 anni
1.558
-0.306
-16.4%
1 gen 1980 anni
1.5
-0.058
-3.7%
1 gen 1981 anni
1.966
+0.466
31.05%
1 gen 1982 anni
1.51
-0.456
-23.18%
1 gen 1983 anni
1.467
-0.043
-2.88%
1 gen 1984 anni
1.27
-0.197
-13.42%
1 gen 1985 anni
1.186
-0.084
-6.64%
1 gen 1986 anni
0.799
-0.387
-32.64%
1 gen 1987 anni
0.772
-0.026
-3.29%
1 gen 1988 anni
0.868
+0.096
12.42%
1 gen 1989 anni
1.073
+0.205
23.57%
1 gen 1990 anni
0.961
-0.112
-10.46%
1 gen 1991 anni
0.883
-0.078
-8.09%
1 gen 1992 anni
0.815
-0.068
-7.71%
1 gen 1993 anni
0.878
+0.063
7.71%
1 gen 1994 anni
0.803
-0.075
-8.57%
1 gen 1995 anni
0.888
+0.085
10.63%
1 gen 1996 anni
0.106
-0.782
-88.05%
1 gen 1997 anni
0.026
-0.08
-75.12%
1 gen 1998 anni
0.002
-0.025
-94.28%
1 gen 1999 anni
-0.001
-0.003
-190.41%
1 gen 2000 anni
-0.012
-0.01
751.43%
1 gen 2001 anni
-0.015
-0.003
25.77%
1 gen 2002 anni
-0.004
+0.011
-73.72%
1 gen 2004 anni
0.002
+0.006
-143.92%
1 gen 2005 anni
0.002
0.0
-3.85%
1 gen 2006 anni
0.002
0.0
-4.15%
1 gen 2014 anni
0.001
0.0
-19.37%
Classificazione dei paesi secondo i statistiche attuali per anni


Commenti: