29
/it/
it
AIzaSyAYiBZKx7MnpbEhh9jyipgxe19OcubqV5w
April 1, 2024
214549
Norway
NOR
true
2
1
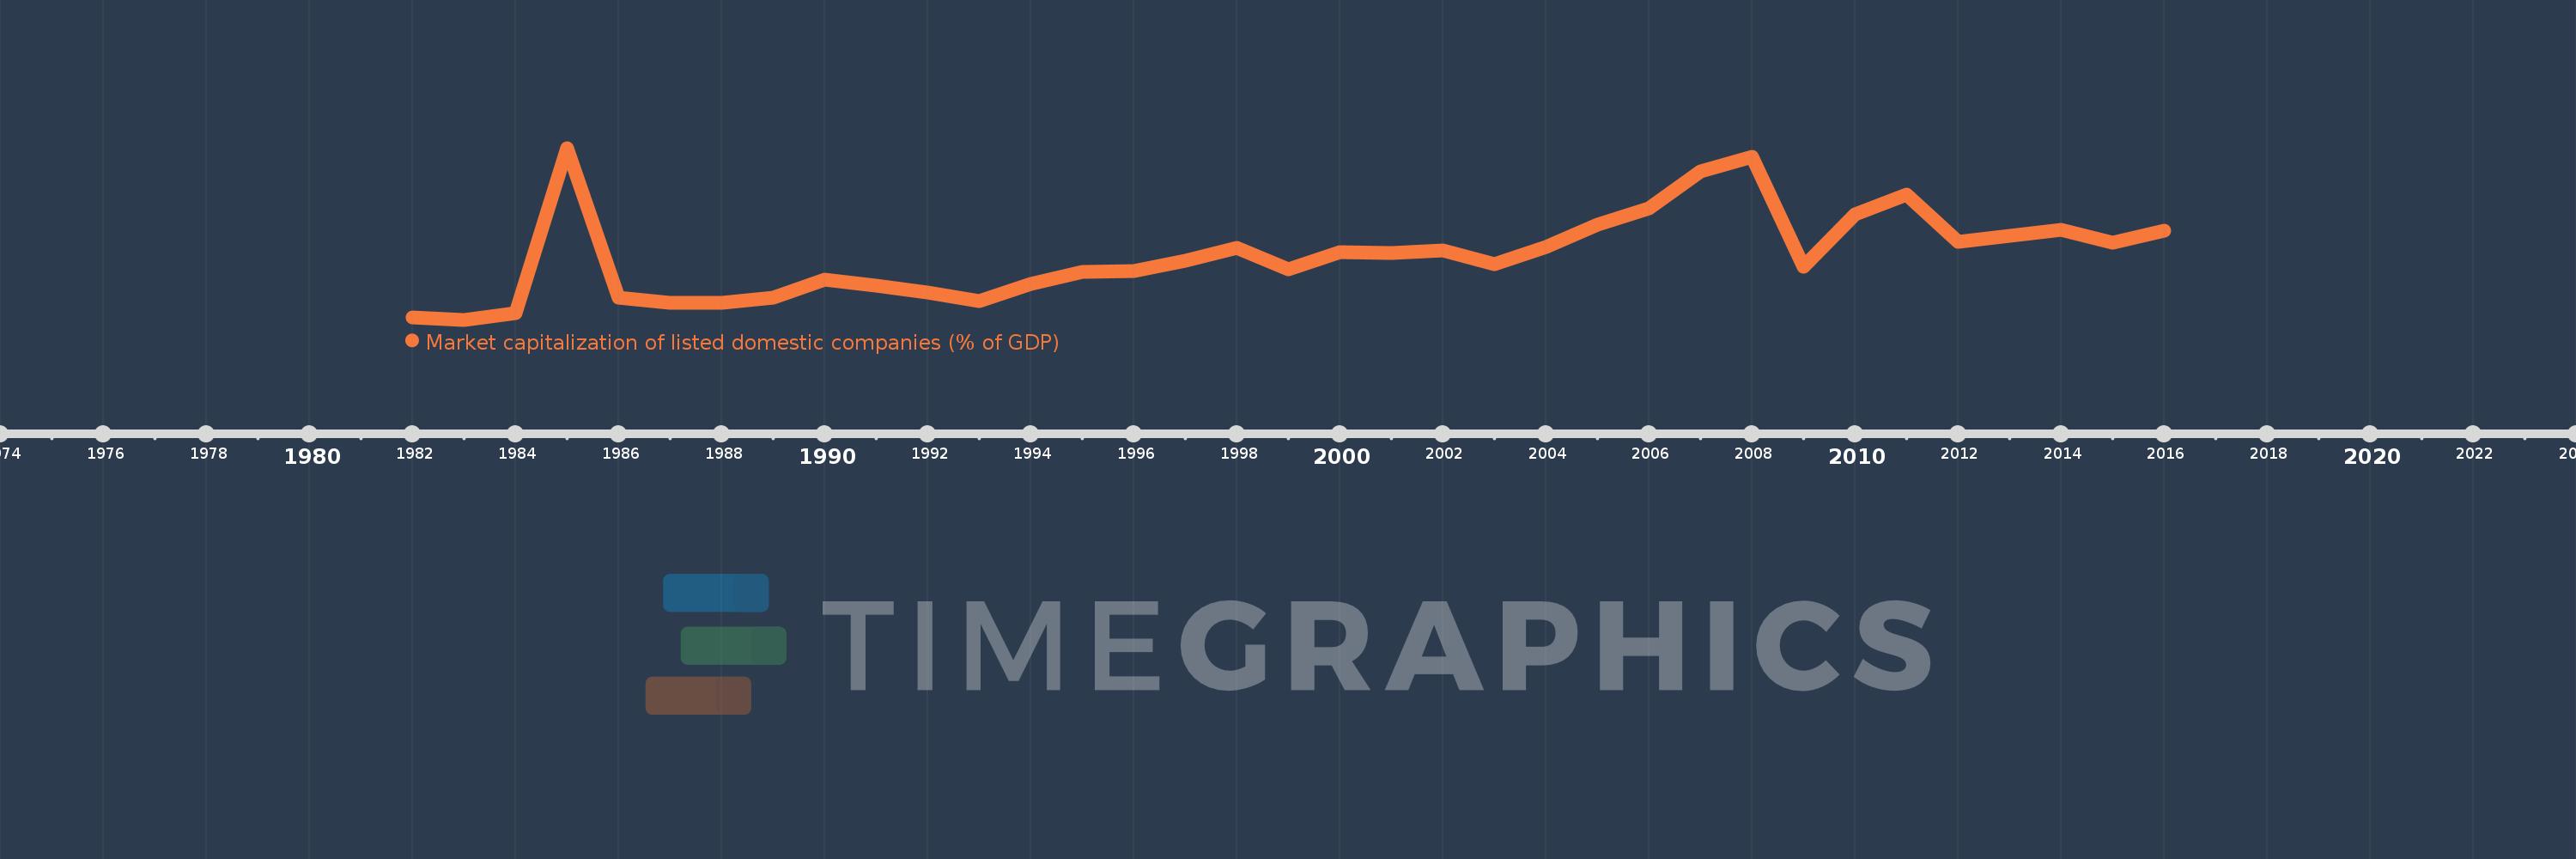
Market capitalization of listed domestic companies (% of GDP)
2016,2015,2014,2013,2012,2011,2010,2009,2008,2007,2006,2005,2004,2003,2002,2001,2000,1999,1998,1997,1996,1995,1994,1993,1992,1991,1990,1989,1988,1987,1986,1985,1984,1983,1982
Queste statistiche in altri paesi:
Linea del tempo:
Questa scala temporale mostra un grafico dal 1982 anno al 2016 anno. Norway. I dati fino ad 1981 anno non disponibili. Il numero di osservazioni attuali secondo i date: 35.
La fonte (nome):
Indicatori dello sviluppo mondiale
La fonte (organizzazione):
World Federation of Exchanges database.
Categorie:
Financial Sector
sono stati aggiornati
23 apr 2017 anni
Indicatori delle variazioni dei valori per anni
Minima:
3.824
1 gen 1983 anni
Massimo:
93.342
1 gen 1985 anni
Alla data di osservazione
Valore
Variazione assoluta
La variazione rispetto al valore precedente
1 gen 1982 anni
5.243
+5.243
0.0%
1 gen 1983 anni
3.824
-1.419
-27.07%
1 gen 1984 anni
7.44
+3.616
94.57%
1 gen 1985 anni
93.342
+85.902
1.15 Mille.%
1 gen 1986 anni
15.382
-77.96
-83.52%
1 gen 1987 anni
12.845
-2.537
-16.49%
1 gen 1988 anni
12.616
-0.229
-1.78%
1 gen 1989 anni
15.462
+2.846
22.56%
1 gen 1990 anni
24.636
+9.174
59.34%
1 gen 1991 anni
21.813
-2.824
-11.46%
1 gen 1992 anni
18.049
-3.763
-17.25%
1 gen 1993 anni
13.635
-4.414
-24.45%
1 gen 1994 anni
22.7
+9.064
66.48%
1 gen 1995 anni
28.678
+5.979
26.34%
1 gen 1996 anni
29.328
+0.65
2.27%
1 gen 1997 anni
34.784
+5.456
18.6%
1 gen 1998 anni
41.219
+6.436
18.5%
1 gen 1999 anni
30.111
-11.108
-26.95%
1 gen 2000 anni
39.252
+9.14
30.36%
1 gen 2001 anni
38.394
-0.858
-2.19%
1 gen 2002 anni
39.922
+1.528
3.98%
1 gen 2003 anni
32.837
-7.085
-17.75%
1 gen 2004 anni
41.932
+9.095
27.7%
1 gen 2005 anni
53.499
+11.568
27.59%
1 gen 2006 anni
61.893
+8.394
15.69%
1 gen 2007 anni
81.306
+19.413
31.36%
1 gen 2008 anni
88.534
+7.228
8.89%
1 gen 2009 anni
31.585
-56.949
-64.32%
1 gen 2010 anni
58.81
+27.225
86.2%
1 gen 2011 anni
68.908
+10.098
17.17%
1 gen 2012 anni
44.351
-24.557
-35.64%
1 gen 2013 anni
47.629
+3.278
7.39%
1 gen 2014 anni
50.766
+3.137
6.59%
1 gen 2015 anni
44.02
-6.746
-13.29%
1 gen 2016 anni
50.157
+6.137
13.94%
Classificazione dei paesi secondo i statistiche attuali per anni


Commenti: