29
/it/
it
AIzaSyAYiBZKx7MnpbEhh9jyipgxe19OcubqV5w
April 1, 2024
151790
Hong Kong SAR, China
HKG
true
2
1
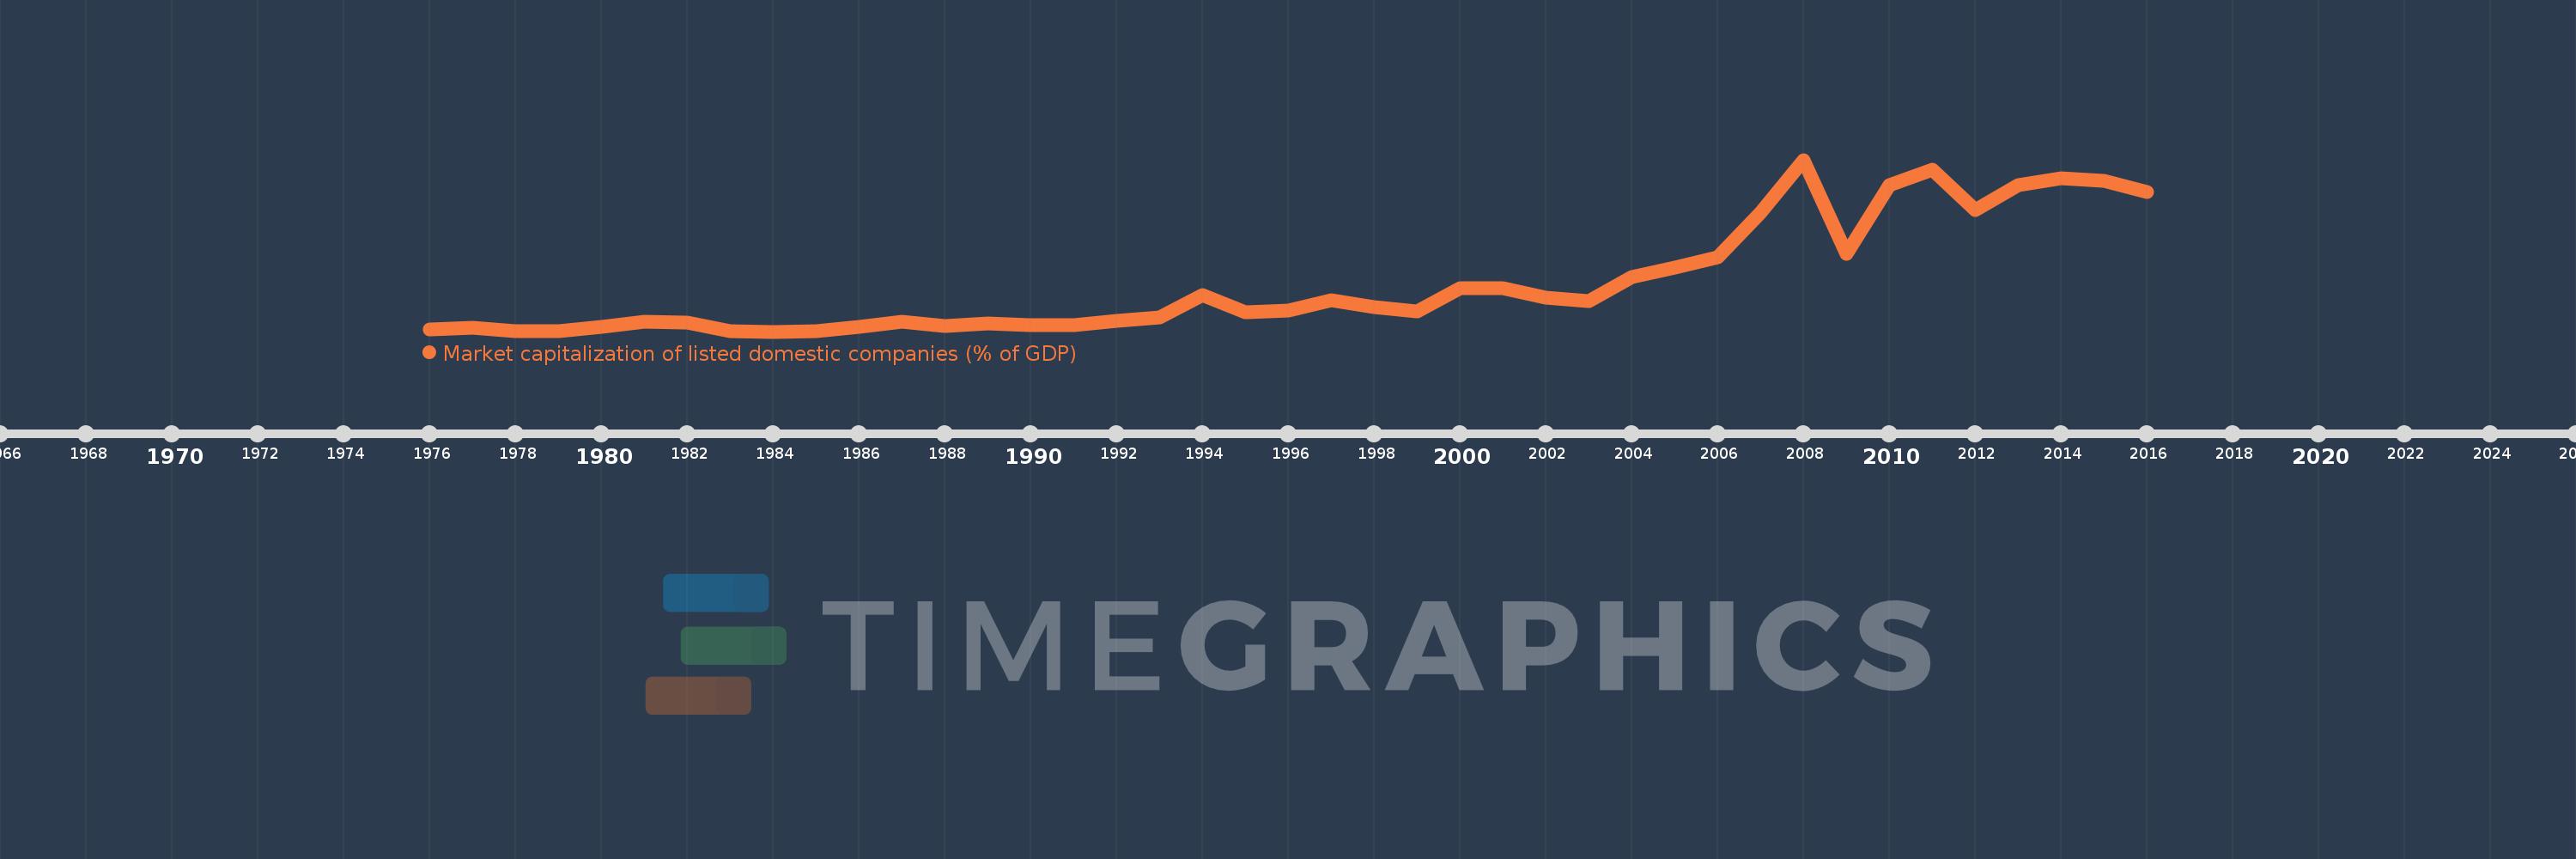
Market capitalization of listed domestic companies (% of GDP)
2016,2015,2014,2013,2012,2011,2010,2009,2008,2007,2006,2005,2004,2003,2002,2001,2000,1999,1998,1997,1996,1995,1994,1993,1992,1991,1990,1989,1988,1987,1986,1985,1984,1983,1982,1981,1980,1979,1978,1977,1976
Queste statistiche in altri paesi:
Linea del tempo:
Questa scala temporale mostra un grafico dal 1976 anno al 2016 anno. Hong Kong SAR, China. I dati fino ad 1975 anno non disponibili. Il numero di osservazioni attuali secondo i date: 41.
La fonte (nome):
Indicatori dello sviluppo mondiale
La fonte (organizzazione):
World Federation of Exchanges database.
Categorie:
Financial Sector
sono stati aggiornati
23 apr 2017 anni
Indicatori delle variazioni dei valori per anni
Minima:
65.396
1 gen 1984 anni
Massimo:
1.254 Mille.
1 gen 2008 anni
Alla data di osservazione
Valore
Variazione assoluta
La variazione rispetto al valore precedente
1 gen 1976 anni
80.613
+80.613
0.0%
1 gen 1977 anni
90.864
+10.251
12.72%
1 gen 1978 anni
66.976
-23.888
-26.29%
1 gen 1979 anni
70.601
+3.625
5.41%
1 gen 1980 anni
98.644
+28.043
39.72%
1 gen 1981 anni
135.173
+36.529
37.03%
1 gen 1982 anni
125.521
-9.652
-7.14%
1 gen 1983 anni
67.162
-58.359
-46.49%
1 gen 1984 anni
65.396
-1.765
-2.63%
1 gen 1985 anni
70.476
+5.08
7.77%
1 gen 1986 anni
96.902
+26.426
37.5%
1 gen 1987 anni
131.085
+34.183
35.28%
1 gen 1988 anni
106.817
-24.267
-18.51%
1 gen 1989 anni
124.62
+17.803
16.67%
1 gen 1990 anni
112.756
-11.864
-9.52%
1 gen 1991 anni
108.394
-4.362
-3.87%
1 gen 1992 anni
137.007
+28.613
26.4%
1 gen 1993 anni
164.937
+27.93
20.39%
1 gen 1994 anni
319.925
+154.988
93.97%
1 gen 1995 anni
198.442
-121.484
-37.97%
1 gen 1996 anni
209.954
+11.513
5.8%
1 gen 1997 anni
281.259
+71.304
33.96%
1 gen 1998 anni
233.051
-48.208
-17.14%
1 gen 1999 anni
203.431
-29.62
-12.71%
1 gen 2000 anni
366.874
+163.443
80.34%
1 gen 2001 anni
363.141
-3.732
-1.02%
1 gen 2002 anni
298.739
-64.403
-17.73%
1 gen 2003 anni
278.363
-20.375
-6.82%
1 gen 2004 anni
442.792
+164.429
59.07%
1 gen 2005 anni
509.441
+66.649
15.05%
1 gen 2006 anni
581.042
+71.602
14.05%
1 gen 2007 anni
886.115
+305.072
52.5%
1 gen 2008 anni
1.254 Mille.
+368.351
41.57%
1 gen 2009 anni
605.97
-648.496
-51.69%
1 gen 2010 anni
1.077 Mille.
+470.966
77.72%
1 gen 2011 anni
1.186 Mille.
+108.921
10.11%
1 gen 2012 anni
908.616
-277.241
-23.38%
1 gen 2013 anni
1.078 Mille.
+169.689
18.68%
1 gen 2014 anni
1.125 Mille.
+46.556
4.32%
1 gen 2015 anni
1.11 Mille.
-14.725
-1.31%
1 gen 2016 anni
1.03 Mille.
-80.213
-7.23%
Classificazione dei paesi secondo i statistiche attuali per anni


Commenti: