29
/it/
it
AIzaSyAYiBZKx7MnpbEhh9jyipgxe19OcubqV5w
April 1, 2024
201960
Morocco
MAR
true
2
1
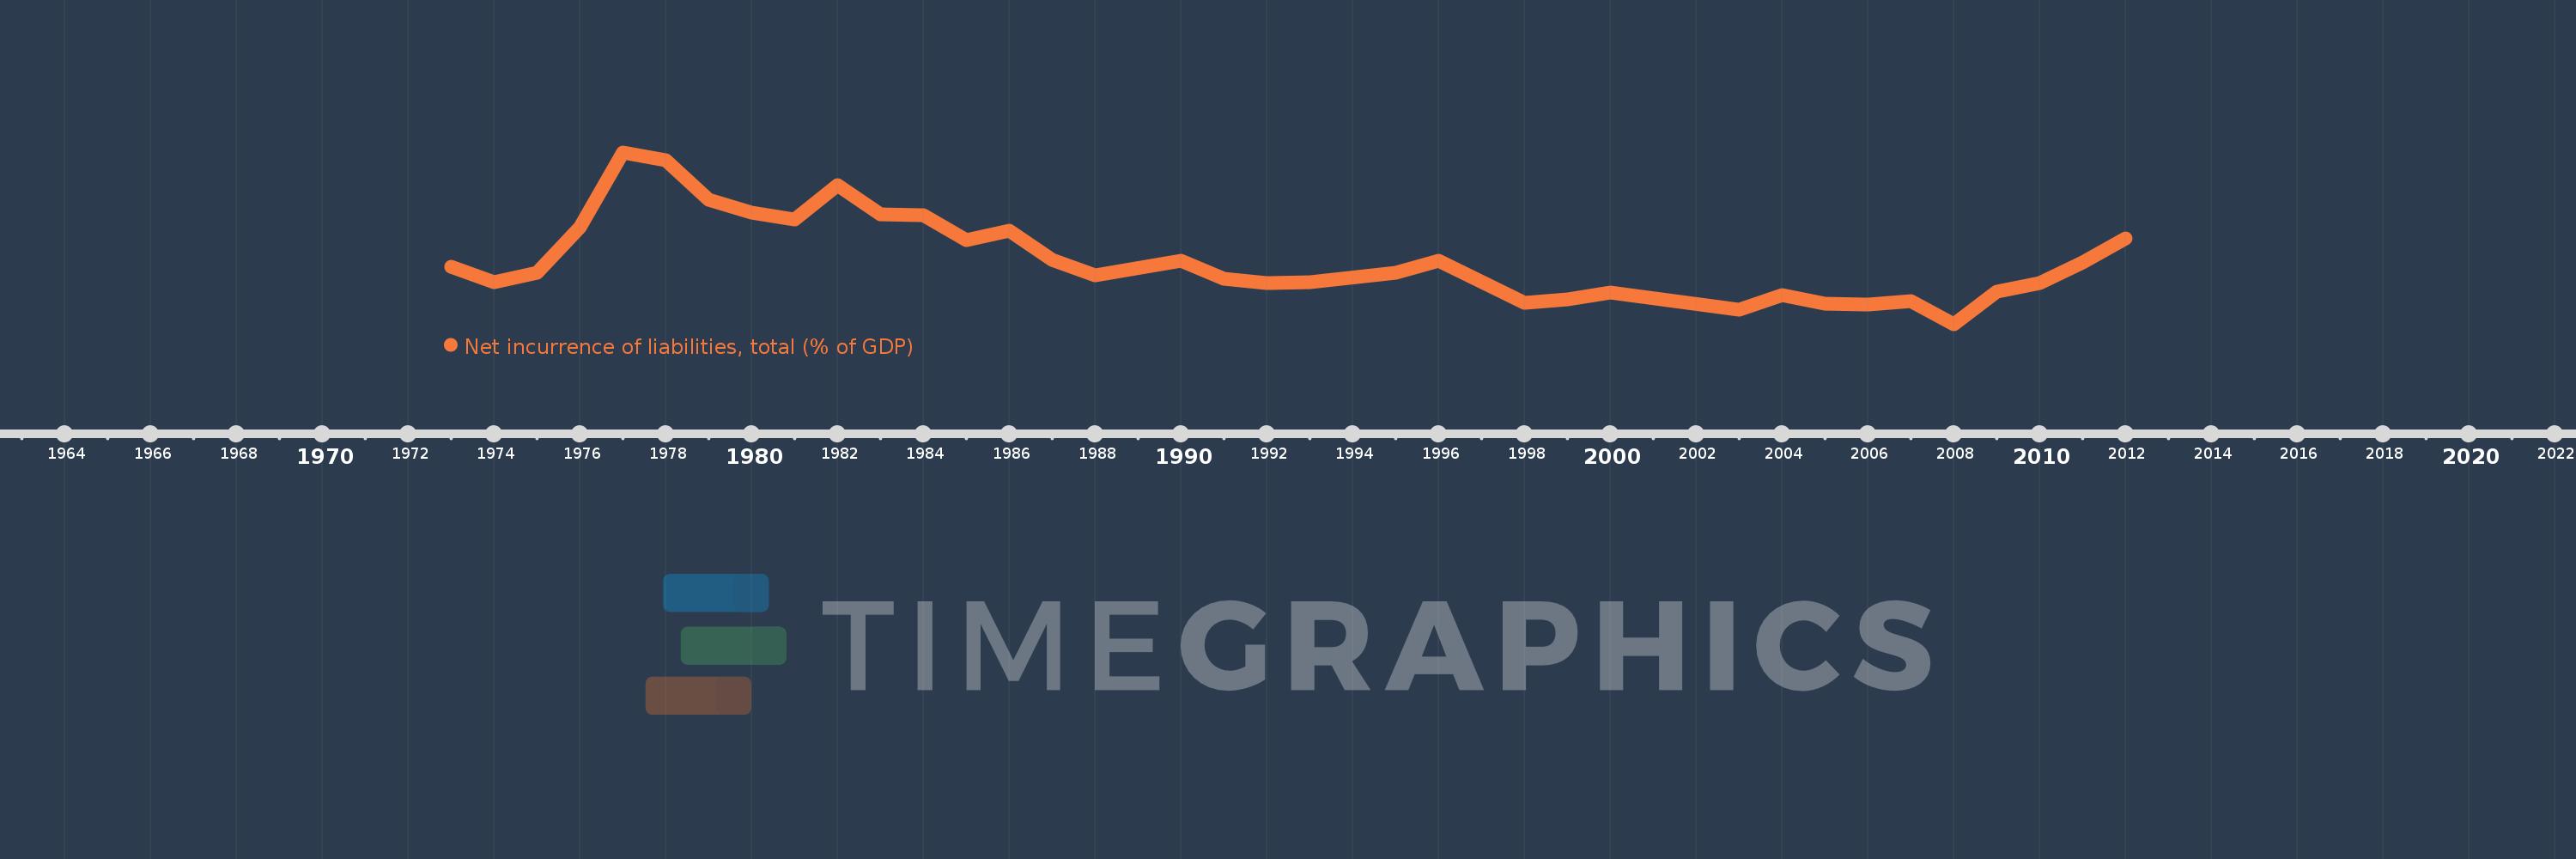
Net incurrence of liabilities, total (% of GDP)
2012,2011,2010,2009,2008,2007,2006,2005,2004,2003,2000,1999,1998,1996,1995,1993,1992,1991,1990,1988,1987,1986,1985,1984,1983,1982,1981,1980,1979,1978,1977,1976,1975,1974,1973
Queste statistiche in altri paesi:
Linea del tempo:
Questa scala temporale mostra un grafico dal 1973 anno al 2012 anno. Morocco. I dati fino ad 1972 anno non disponibili. Il numero di osservazioni attuali secondo i date: 35.
La fonte (nome):
Indicatori dello sviluppo mondiale
La fonte (organizzazione):
International Monetary Fund, Government Finance Statistics Yearbook and data files.
Categorie:
Public Sector
sono stati aggiornati
23 apr 2017 anni
Indicatori delle variazioni dei valori per anni
Minima:
-2.605
1 gen 2008 anni
Massimo:
15.75
1 gen 1977 anni
Alla data di osservazione
Valore
Variazione assoluta
La variazione rispetto al valore precedente
1 gen 1973 anni
3.5
+3.5
0.0%
1 gen 1974 anni
1.845
-1.655
-47.28%
1 gen 1975 anni
2.874
+1.029
55.78%
1 gen 1976 anni
7.756
+4.882
169.85%
1 gen 1977 anni
15.75
+7.994
103.07%
1 gen 1978 anni
14.881
-0.869
-5.52%
1 gen 1979 anni
10.685
-4.197
-28.2%
1 gen 1980 anni
9.305
-1.38
-12.91%
1 gen 1981 anni
8.576
-0.728
-7.83%
1 gen 1982 anni
12.224
+3.648
42.53%
1 gen 1983 anni
9.104
-3.121
-25.53%
1 gen 1984 anni
9.015
-0.088
-0.97%
1 gen 1985 anni
6.417
-2.598
-28.82%
1 gen 1986 anni
7.419
+1.002
15.61%
1 gen 1987 anni
4.268
-3.151
-42.48%
1 gen 1988 anni
2.646
-1.622
-38.0%
1 gen 1990 anni
4.195
+1.549
58.53%
1 gen 1991 anni
2.224
-1.97
-46.97%
1 gen 1992 anni
1.784
-0.44
-19.79%
1 gen 1993 anni
1.866
+0.082
4.59%
1 gen 1995 anni
2.906
+1.04
55.71%
1 gen 1996 anni
4.154
+1.248
42.95%
1 gen 1998 anni
-0.357
-4.511
-108.59%
1 gen 1999 anni
0.038
+0.394
-110.54%
1 gen 2000 anni
0.749
+0.712
1.89 Mille.%
1 gen 2003 anni
-1.029
-1.778
-237.3%
1 gen 2004 anni
0.521
+1.55
-150.65%
1 gen 2005 anni
-0.438
-0.959
-183.95%
1 gen 2006 anni
-0.476
-0.038
8.75%
1 gen 2007 anni
-0.163
+0.313
-65.83%
1 gen 2008 anni
-2.605
-2.442
1.5 Mille.%
1 gen 2009 anni
0.883
+3.488
-133.9%
1 gen 2010 anni
1.834
+0.951
107.71%
1 gen 2011 anni
4.03
+2.196
119.76%
1 gen 2012 anni
6.595
+2.564
63.62%
Classificazione dei paesi secondo i statistiche attuali per anni


Commenti: