29
/it/
it
AIzaSyAYiBZKx7MnpbEhh9jyipgxe19OcubqV5w
April 1, 2024
160812
Israel
ISR
true
2
1
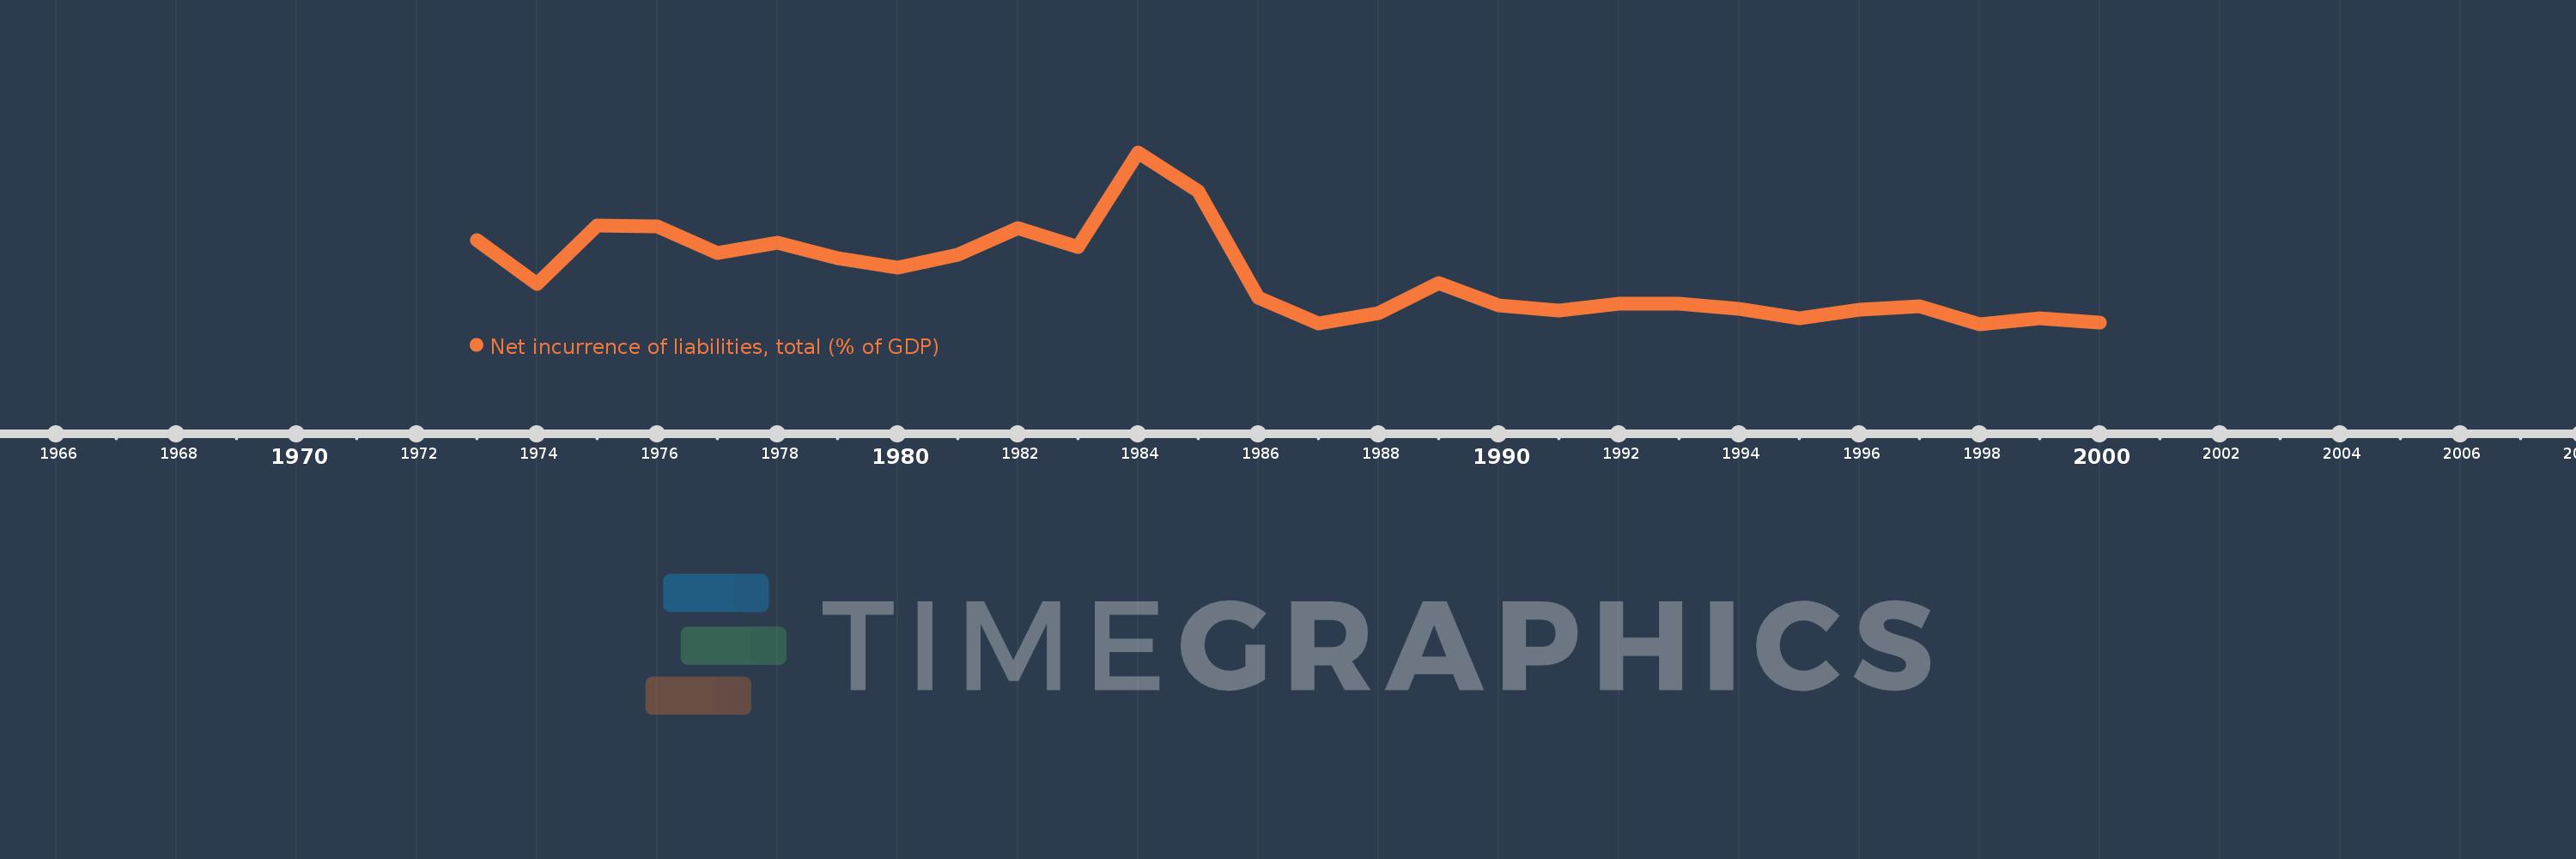
Net incurrence of liabilities, total (% of GDP)
2000,1999,1998,1997,1996,1995,1994,1993,1992,1991,1990,1989,1988,1987,1986,1985,1984,1983,1982,1981,1980,1979,1978,1977,1976,1975,1974,1973
Queste statistiche in altri paesi:
Linea del tempo:
Questa scala temporale mostra un grafico dal 1973 anno al 2000 anno. Israel. I dati fino ad 1972 anno non disponibili. Il numero di osservazioni attuali secondo i date: 28.
La fonte (nome):
Indicatori dello sviluppo mondiale
La fonte (organizzazione):
International Monetary Fund, Government Finance Statistics Yearbook and data files.
Categorie:
Public Sector
sono stati aggiornati
23 apr 2017 anni
Indicatori delle variazioni dei valori per anni
Minima:
1.272
1 gen 1998 anni
Massimo:
39.455
1 gen 1984 anni
Alla data di osservazione
Valore
Variazione assoluta
La variazione rispetto al valore precedente
1 gen 1973 anni
20.01
+20.01
0.0%
1 gen 1974 anni
10.318
-9.692
-48.44%
1 gen 1975 anni
23.237
+12.919
125.21%
1 gen 1976 anni
23.027
-0.21
-0.9%
1 gen 1977 anni
17.193
-5.834
-25.34%
1 gen 1978 anni
19.458
+2.265
13.18%
1 gen 1979 anni
16.003
-3.455
-17.75%
1 gen 1980 anni
13.936
-2.068
-12.92%
1 gen 1981 anni
16.754
+2.819
20.23%
1 gen 1982 anni
22.704
+5.95
35.51%
1 gen 1983 anni
18.447
-4.257
-18.75%
1 gen 1984 anni
39.455
+21.008
113.88%
1 gen 1985 anni
30.788
-8.666
-21.97%
1 gen 1986 anni
7.173
-23.616
-76.7%
1 gen 1987 anni
1.468
-5.705
-79.54%
1 gen 1988 anni
3.697
+2.23
151.9%
1 gen 1989 anni
10.355
+6.658
180.07%
1 gen 1990 anni
5.457
-4.898
-47.3%
1 gen 1991 anni
4.299
-1.158
-21.23%
1 gen 1992 anni
5.85
+1.551
36.08%
1 gen 1993 anni
5.75
-0.1
-1.71%
1 gen 1994 anni
4.7
-1.05
-18.25%
1 gen 1995 anni
2.554
-2.146
-45.66%
1 gen 1996 anni
4.476
+1.922
75.24%
1 gen 1997 anni
5.286
+0.81
18.1%
1 gen 1998 anni
1.272
-4.014
-75.93%
1 gen 1999 anni
2.657
+1.385
108.87%
1 gen 2000 anni
1.643
-1.015
-38.19%
Classificazione dei paesi secondo i statistiche attuali per anni


Commenti: