29
/it/
it
AIzaSyAYiBZKx7MnpbEhh9jyipgxe19OcubqV5w
April 1, 2024
193015
Mauritania
MRT
true
2
1
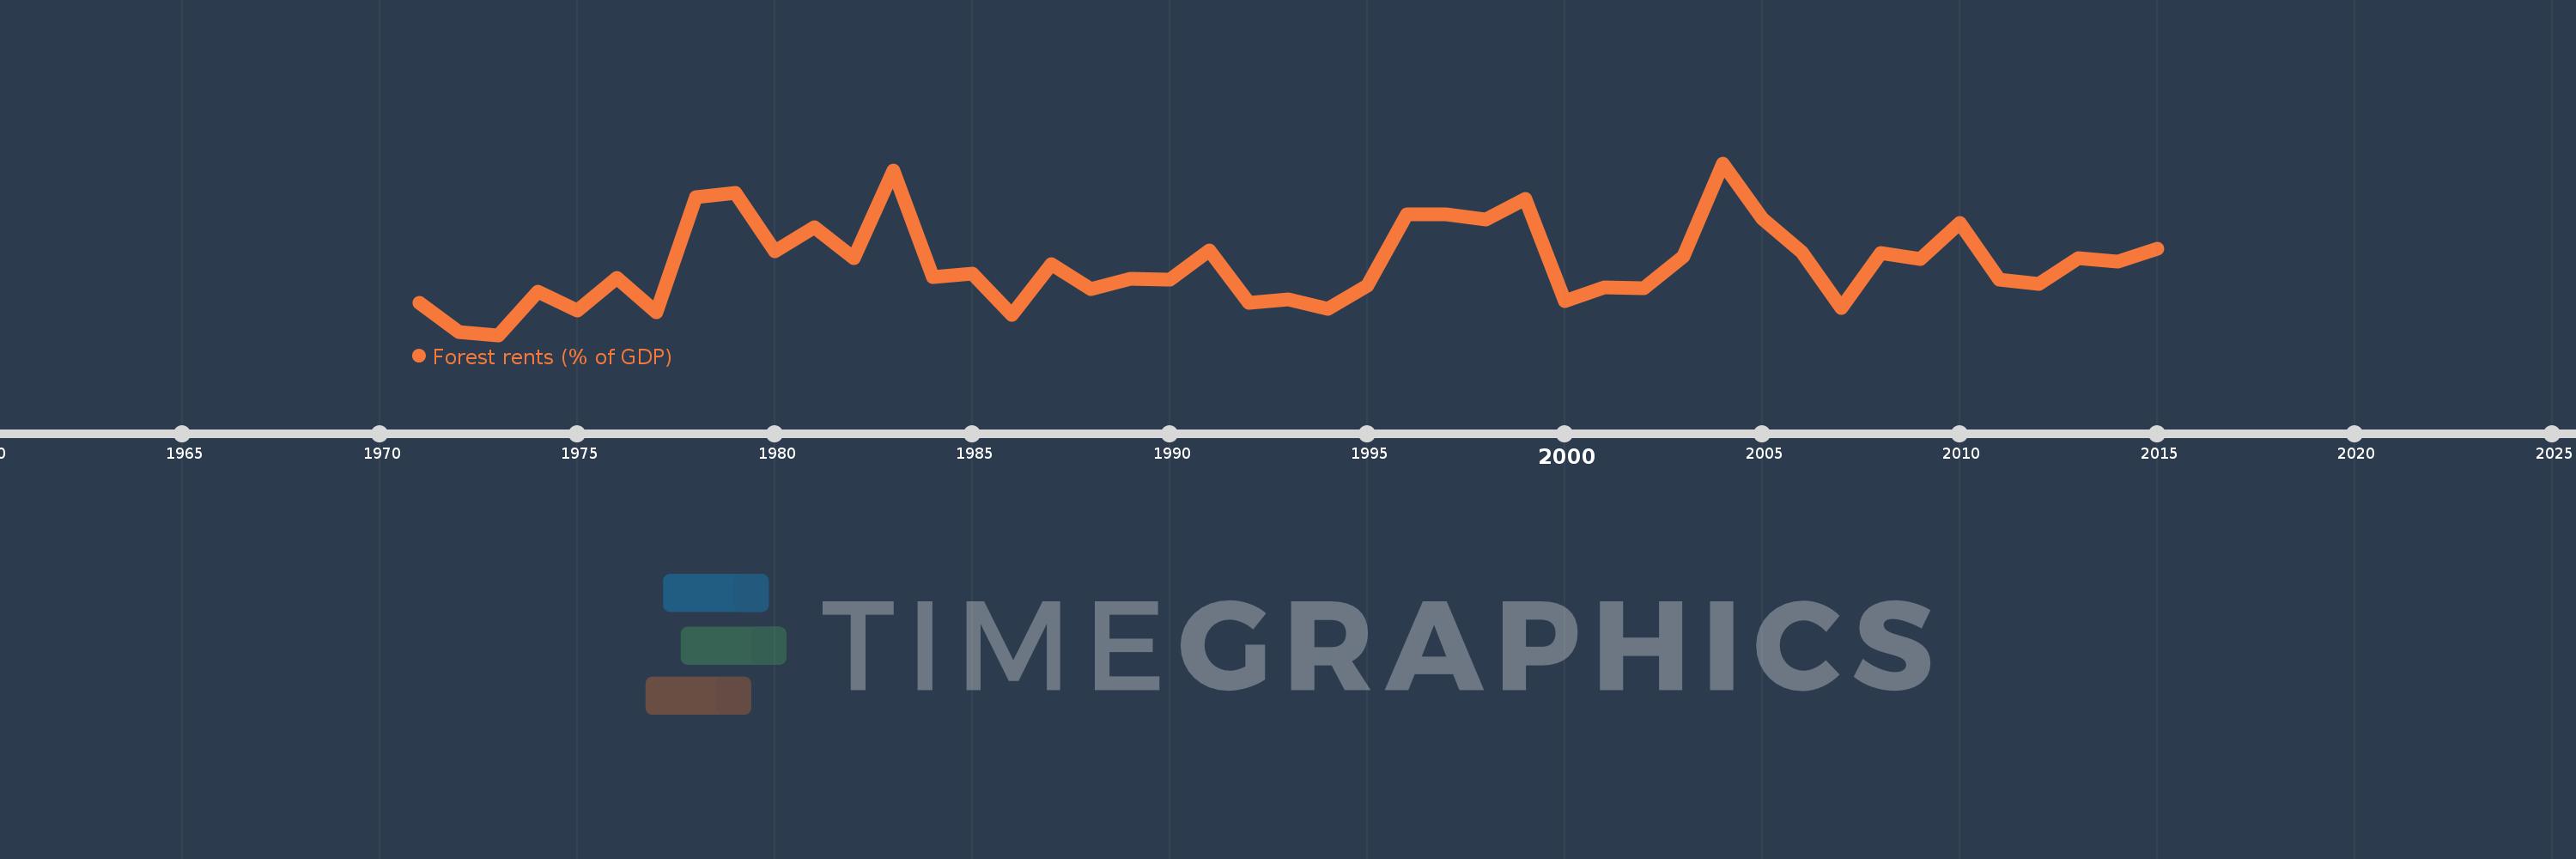
Forest rents (% of GDP)
2015,2014,2013,2012,2011,2010,2009,2008,2007,2006,2005,2004,2003,2002,2001,2000,1999,1998,1997,1996,1995,1994,1993,1992,1991,1990,1989,1988,1987,1986,1985,1984,1983,1982,1981,1980,1979,1978,1977,1976,1975,1974,1973,1972,1971
Queste statistiche in altri paesi:
AfghanistanAlbaniaAlgeriaAndorraAngolaArab WorldArgentinaArmeniaArubaAustraliaAustriaAzerbaijanBahamas, TheBahrainBangladeshBarbadosBelarusBelgiumBelizeBeninBhutanBoliviaBosnia and HerzegovinaBotswanaBrazilBrunei DarussalamBulgariaBurkina FasoBurundiCabo VerdeCambodiaCameroonCanadaCaribbean small statesCentral African RepublicCentral Europe and the BalticsChadChileChinaColombiaComorosCongo, Dem. Rep.Congo, Rep.Costa RicaCote d'IvoireCroatiaCubaCyprusCzech RepublicDenmarkDjiboutiDominicaDominican RepublicEarly-demographic dividendEast Asia & PacificEast Asia & Pacific (excluding high income)East Asia & Pacific (IDA & IBRD countries)EcuadorEgypt, Arab Rep.El SalvadorEquatorial GuineaEritreaEstoniaEthiopiaEuro areaEurope & Central AsiaEurope & Central Asia (excluding high income)Europe & Central Asia (IDA & IBRD countries)European UnionFaroe IslandsFijiFinlandFragile and conflict affected situationsFranceFrench PolynesiaGabonGambia, TheGeorgiaGermanyGhanaGreeceGuatemalaGuineaGuinea-BissauGuyanaHaitiHeavily indebted poor countries (HIPC)High incomeHondurasHong Kong SAR, ChinaHungaryIBRD onlyIcelandIDA & IBRD totalIDA blendIDA onlyIDA totalIndiaIndonesiaIran, Islamic Rep.IraqIrelandIsraelItalyJamaicaJapanJordanKazakhstanKenyaKiribatiKorea, Rep.KuwaitKyrgyz RepublicLao PDRLate-demographic dividendLatin America & Caribbean Latin America & Caribbean (excluding high income)Latin America & the Caribbean (IDA & IBRD countries)LatviaLeast developed countries: UN classificationLebanonLesothoLiberiaLibyaLiechtensteinLithuaniaLow & middle incomeLow incomeLower middle incomeLuxembourgMacao SAR, ChinaMacedonia, FYRMadagascarMalawiMalaysiaMaldivesMaliMaltaMauritaniaMauritiusMexicoMicronesia, Fed. Sts.Middle East & North AfricaMiddle East & North Africa (excluding high income)Middle East & North Africa (IDA & IBRD countries)Middle incomeMoldovaMongoliaMontenegroMoroccoMozambiqueMyanmarNamibiaNepalNetherlandsNew CaledoniaNew ZealandNicaraguaNigerNigeriaNorth AmericaNorwayOECD membersOmanOther small statesPacific island small statesPakistanPanamaPapua New GuineaParaguayPeruPhilippinesPolandPortugalPost-demographic dividendPre-demographic dividendQatarRomaniaRussian FederationRwandaSamoaSao Tome and PrincipeSaudi ArabiaSenegalSerbiaSeychellesSierra LeoneSingaporeSlovak RepublicSloveniaSmall statesSolomon IslandsSomaliaSouth AfricaSouth AsiaSouth Asia (IDA & IBRD)South SudanSpainSri LankaSt. LuciaSt. Vincent and the GrenadinesSub-Saharan Africa Sub-Saharan Africa (excluding high income)Sub-Saharan Africa (IDA & IBRD countries)SudanSurinameSwazilandSwedenSwitzerlandSyrian Arab RepublicTajikistanTanzaniaThailandTimor-LesteTogoTongaTrinidad and TobagoTunisiaTurkeyTurkmenistanUgandaUkraineUnited Arab EmiratesUnited KingdomUnited StatesUpper middle incomeUruguayUzbekistanVanuatuVenezuela, RBVietnamWorldYemen, Rep.ZambiaZimbabwe Linea del tempo:
Questa scala temporale mostra un grafico dal 1971 anno al 2015 anno. Mauritania. I dati fino ad 1970 anno non disponibili. Il numero di osservazioni attuali secondo i date: 45.
La fonte (nome):
Indicatori dello sviluppo mondiale
La fonte (organizzazione):
Estimates based on sources and methods described in "The Changing Wealth of Nations: Measuring Sustainable Development in the New Millennium" (World Bank, 2011).
Categorie:
Environment
sono stati aggiornati
23 apr 2017 anni
Indicatori delle variazioni dei valori per anni
Minima:
1.173
1 gen 1973 anni
Massimo:
3.094
1 gen 2004 anni
Alla data di osservazione
Valore
Variazione assoluta
La variazione rispetto al valore precedente
1 gen 1971 anni
1.529
+1.529
0.0%
1 gen 1972 anni
1.209
-0.32
-20.92%
1 gen 1973 anni
1.173
-0.036
-2.95%
1 gen 1974 anni
1.661
+0.488
41.59%
1 gen 1975 anni
1.443
-0.219
-13.17%
1 gen 1976 anni
1.807
+0.365
25.28%
1 gen 1977 anni
1.432
-0.375
-20.75%
1 gen 1978 anni
2.71
+1.278
89.24%
1 gen 1979 anni
2.764
+0.053
1.97%
1 gen 1980 anni
2.105
-0.659
-23.85%
1 gen 1981 anni
2.374
+0.269
12.79%
1 gen 1982 anni
2.031
-0.343
-14.46%
1 gen 1983 anni
3.01
+0.979
48.22%
1 gen 1984 anni
1.818
-1.192
-39.6%
1 gen 1985 anni
1.86
+0.042
2.3%
1 gen 1986 anni
1.4
-0.46
-24.72%
1 gen 1987 anni
1.967
+0.567
40.51%
1 gen 1988 anni
1.689
-0.278
-14.16%
1 gen 1989 anni
1.806
+0.118
6.96%
1 gen 1990 anni
1.79
-0.016
-0.89%
1 gen 1991 anni
2.121
+0.331
18.49%
1 gen 1992 anni
1.537
-0.584
-27.51%
1 gen 1993 anni
1.569
+0.031
2.03%
1 gen 1994 anni
1.463
-0.106
-6.74%
1 gen 1995 anni
1.724
+0.261
17.86%
1 gen 1996 anni
2.518
+0.794
46.04%
1 gen 1997 anni
2.519
+0.001
0.06%
1 gen 1998 anni
2.469
-0.051
-2.0%
1 gen 1999 anni
2.694
+0.225
9.12%
1 gen 2000 anni
1.554
-1.14
-42.3%
1 gen 2001 anni
1.71
+0.156
10.04%
1 gen 2002 anni
1.696
-0.015
-0.87%
1 gen 2003 anni
2.049
+0.353
20.83%
1 gen 2004 anni
3.094
+1.045
51.02%
1 gen 2005 anni
2.473
-0.621
-20.06%
1 gen 2006 anni
2.096
-0.377
-15.26%
1 gen 2007 anni
1.476
-0.62
-29.59%
1 gen 2008 anni
2.095
+0.62
41.99%
1 gen 2009 anni
2.026
-0.07
-3.33%
1 gen 2010 anni
2.422
+0.396
19.55%
1 gen 2011 anni
1.788
-0.633
-26.15%
1 gen 2012 anni
1.745
-0.044
-2.44%
1 gen 2013 anni
2.037
+0.293
16.77%
1 gen 2014 anni
1.99
-0.048
-2.33%
1 gen 2015 anni
2.143
+0.153
7.68%
Classificazione dei paesi secondo i statistiche attuali per anni


Commenti: