29
/it/
it
AIzaSyAYiBZKx7MnpbEhh9jyipgxe19OcubqV5w
April 1, 2024
136712
Gambia, The
GMB
true
2
1
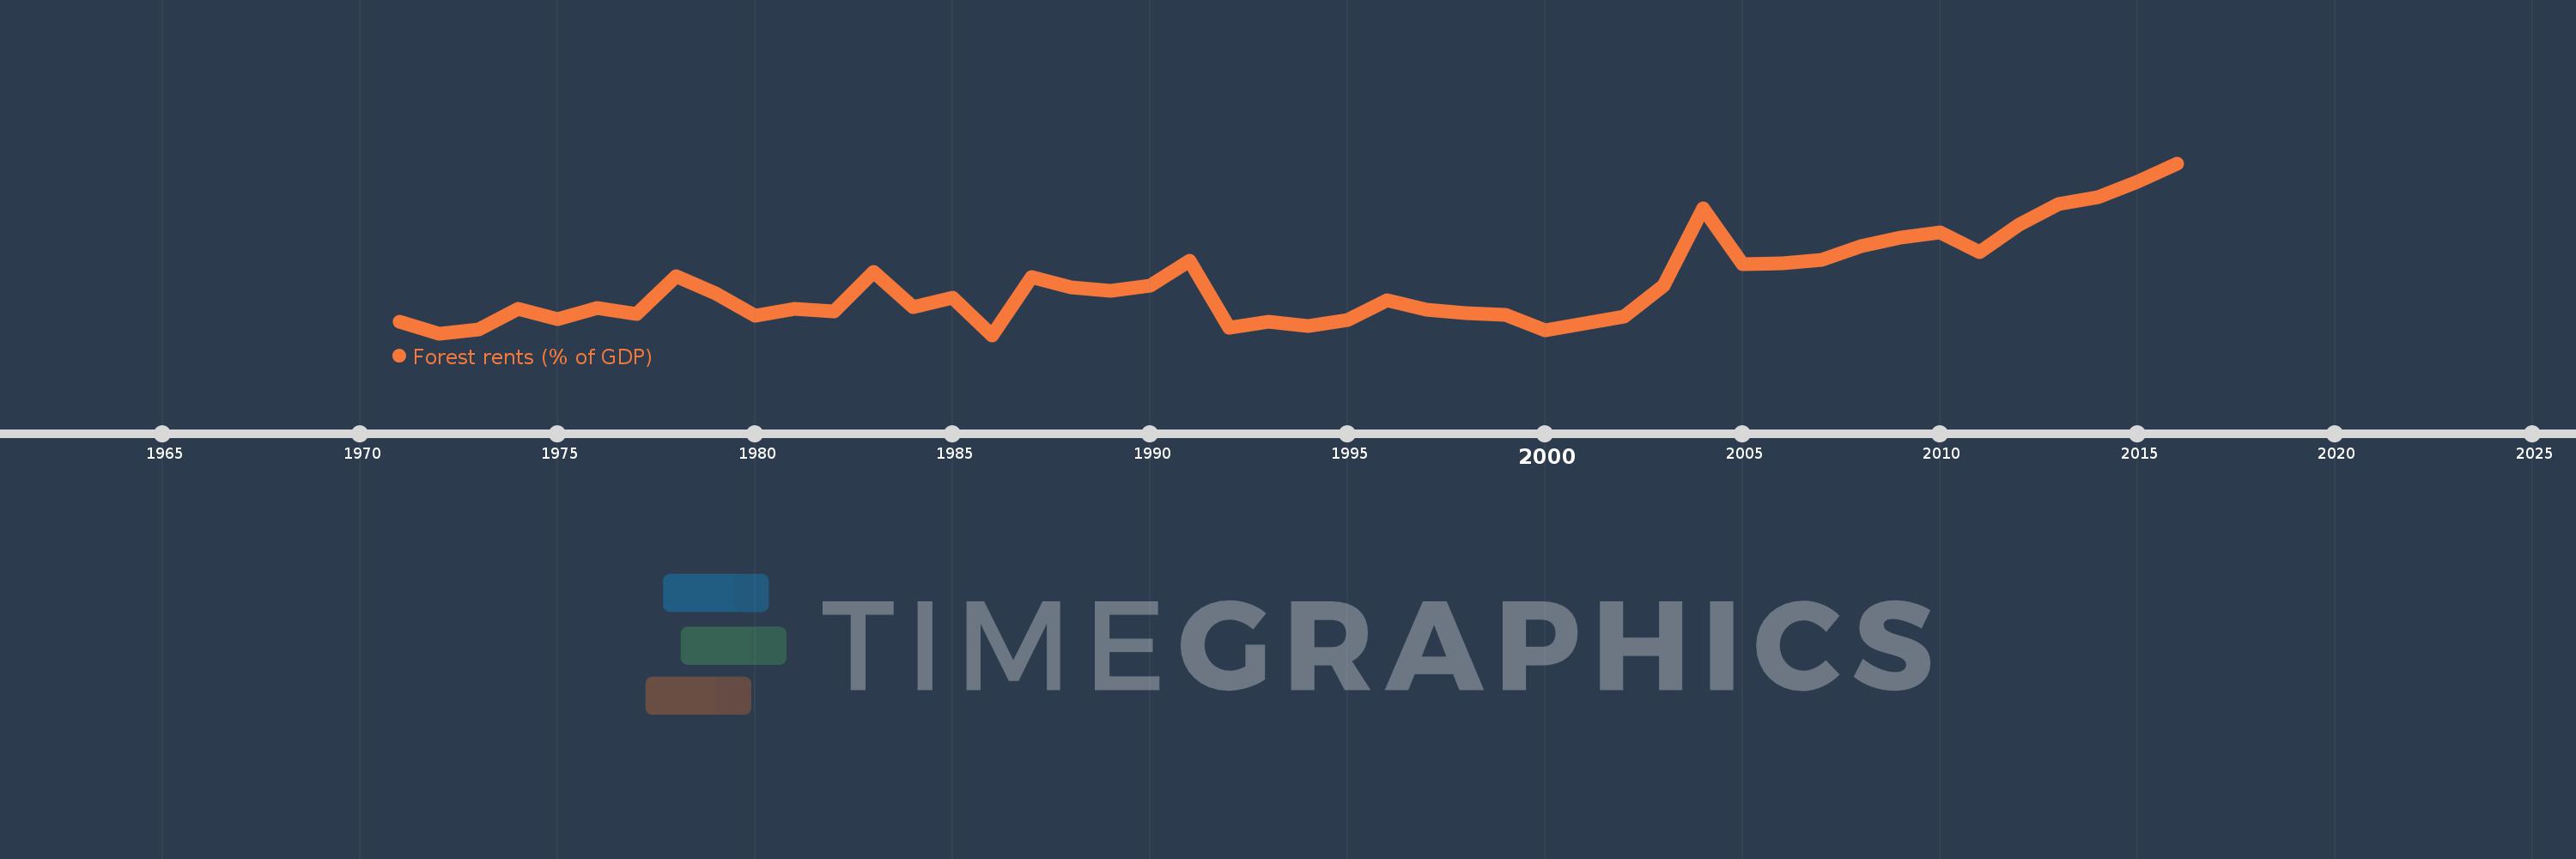
Forest rents (% of GDP)
2016,2015,2014,2013,2012,2011,2010,2009,2008,2007,2006,2005,2004,2003,2002,2001,2000,1999,1998,1997,1996,1995,1994,1993,1992,1991,1990,1989,1988,1987,1986,1985,1984,1983,1982,1981,1980,1979,1978,1977,1976,1975,1974,1973,1972,1971
Queste statistiche in altri paesi:
AfghanistanAlbaniaAlgeriaAndorraAngolaArab WorldArgentinaArmeniaArubaAustraliaAustriaAzerbaijanBahamas, TheBahrainBangladeshBarbadosBelarusBelgiumBelizeBeninBhutanBoliviaBosnia and HerzegovinaBotswanaBrazilBrunei DarussalamBulgariaBurkina FasoBurundiCabo VerdeCambodiaCameroonCanadaCaribbean small statesCentral African RepublicCentral Europe and the BalticsChadChileChinaColombiaComorosCongo, Dem. Rep.Congo, Rep.Costa RicaCote d'IvoireCroatiaCubaCyprusCzech RepublicDenmarkDjiboutiDominicaDominican RepublicEarly-demographic dividendEast Asia & PacificEast Asia & Pacific (excluding high income)East Asia & Pacific (IDA & IBRD countries)EcuadorEgypt, Arab Rep.El SalvadorEquatorial GuineaEritreaEstoniaEthiopiaEuro areaEurope & Central AsiaEurope & Central Asia (excluding high income)Europe & Central Asia (IDA & IBRD countries)European UnionFaroe IslandsFijiFinlandFragile and conflict affected situationsFranceFrench PolynesiaGabonGambia, TheGeorgiaGermanyGhanaGreeceGuatemalaGuineaGuinea-BissauGuyanaHaitiHeavily indebted poor countries (HIPC)High incomeHondurasHong Kong SAR, ChinaHungaryIBRD onlyIcelandIDA & IBRD totalIDA blendIDA onlyIDA totalIndiaIndonesiaIran, Islamic Rep.IraqIrelandIsraelItalyJamaicaJapanJordanKazakhstanKenyaKiribatiKorea, Rep.KuwaitKyrgyz RepublicLao PDRLate-demographic dividendLatin America & Caribbean Latin America & Caribbean (excluding high income)Latin America & the Caribbean (IDA & IBRD countries)LatviaLeast developed countries: UN classificationLebanonLesothoLiberiaLibyaLiechtensteinLithuaniaLow & middle incomeLow incomeLower middle incomeLuxembourgMacao SAR, ChinaMacedonia, FYRMadagascarMalawiMalaysiaMaldivesMaliMaltaMauritaniaMauritiusMexicoMicronesia, Fed. Sts.Middle East & North AfricaMiddle East & North Africa (excluding high income)Middle East & North Africa (IDA & IBRD countries)Middle incomeMoldovaMongoliaMontenegroMoroccoMozambiqueMyanmarNamibiaNepalNetherlandsNew CaledoniaNew ZealandNicaraguaNigerNigeriaNorth AmericaNorwayOECD membersOmanOther small statesPacific island small statesPakistanPanamaPapua New GuineaParaguayPeruPhilippinesPolandPortugalPost-demographic dividendPre-demographic dividendQatarRomaniaRussian FederationRwandaSamoaSao Tome and PrincipeSaudi ArabiaSenegalSerbiaSeychellesSierra LeoneSingaporeSlovak RepublicSloveniaSmall statesSolomon IslandsSomaliaSouth AfricaSouth AsiaSouth Asia (IDA & IBRD)South SudanSpainSri LankaSt. LuciaSt. Vincent and the GrenadinesSub-Saharan Africa Sub-Saharan Africa (excluding high income)Sub-Saharan Africa (IDA & IBRD countries)SudanSurinameSwazilandSwedenSwitzerlandSyrian Arab RepublicTajikistanTanzaniaThailandTimor-LesteTogoTongaTrinidad and TobagoTunisiaTurkeyTurkmenistanUgandaUkraineUnited Arab EmiratesUnited KingdomUnited StatesUpper middle incomeUruguayUzbekistanVanuatuVenezuela, RBVietnamWorldYemen, Rep.ZambiaZimbabwe Linea del tempo:
Questa scala temporale mostra un grafico dal 1971 anno al 2016 anno. Gambia, The. I dati fino ad 1970 anno non disponibili. Il numero di osservazioni attuali secondo i date: 46.
La fonte (nome):
Indicatori dello sviluppo mondiale
La fonte (organizzazione):
Estimates based on sources and methods described in "The Changing Wealth of Nations: Measuring Sustainable Development in the New Millennium" (World Bank, 2011).
Categorie:
Environment
sono stati aggiornati
23 apr 2017 anni
Indicatori delle variazioni dei valori per anni
Minima:
1.854
1 gen 1986 anni
Massimo:
7.665
1 gen 2016 anni
Alla data di osservazione
Valore
Variazione assoluta
La variazione rispetto al valore precedente
1 gen 1971 anni
2.304
+2.304
0.0%
1 gen 1972 anni
1.887
-0.416
-18.07%
1 gen 1973 anni
2.055
+0.168
8.9%
1 gen 1974 anni
2.753
+0.697
33.93%
1 gen 1975 anni
2.38
-0.373
-13.54%
1 gen 1976 anni
2.767
+0.387
16.24%
1 gen 1977 anni
2.559
-0.208
-7.51%
1 gen 1978 anni
3.838
+1.28
50.02%
1 gen 1979 anni
3.274
-0.564
-14.7%
1 gen 1980 anni
2.499
-0.775
-23.68%
1 gen 1981 anni
2.74
+0.241
9.64%
1 gen 1982 anni
2.667
-0.072
-2.64%
1 gen 1983 anni
3.995
+1.327
49.76%
1 gen 1984 anni
2.8
-1.194
-29.9%
1 gen 1985 anni
3.107
+0.307
10.96%
1 gen 1986 anni
1.854
-1.253
-40.32%
1 gen 1987 anni
3.81
+1.955
105.43%
1 gen 1988 anni
3.459
-0.351
-9.21%
1 gen 1989 anni
3.352
-0.106
-3.07%
1 gen 1990 anni
3.512
+0.159
4.75%
1 gen 1991 anni
4.354
+0.843
24.0%
1 gen 1992 anni
2.11
-2.244
-51.55%
1 gen 1993 anni
2.312
+0.202
9.58%
1 gen 1994 anni
2.154
-0.158
-6.84%
1 gen 1995 anni
2.372
+0.218
10.14%
1 gen 1996 anni
3.037
+0.665
28.02%
1 gen 1997 anni
2.698
-0.339
-11.18%
1 gen 1998 anni
2.609
-0.088
-3.28%
1 gen 1999 anni
2.545
-0.064
-2.46%
1 gen 2000 anni
2.0
-0.545
-21.4%
1 gen 2001 anni
2.254
+0.254
12.7%
1 gen 2002 anni
2.473
+0.219
9.71%
1 gen 2003 anni
3.526
+1.053
42.56%
1 gen 2004 anni
6.128
+2.603
73.82%
1 gen 2005 anni
4.243
-1.886
-30.77%
1 gen 2006 anni
4.275
+0.032
0.76%
1 gen 2007 anni
4.39
+0.115
2.69%
1 gen 2008 anni
4.856
+0.466
10.62%
1 gen 2009 anni
5.152
+0.296
6.1%
1 gen 2010 anni
5.314
+0.162
3.14%
1 gen 2011 anni
4.645
-0.668
-12.58%
1 gen 2012 anni
5.579
+0.933
20.09%
1 gen 2013 anni
6.296
+0.717
12.86%
1 gen 2014 anni
6.512
+0.216
3.42%
1 gen 2015 anni
7.026
+0.515
7.91%
1 gen 2016 anni
7.665
+0.639
9.09%
Classificazione dei paesi secondo i statistiche attuali per anni


Commenti: