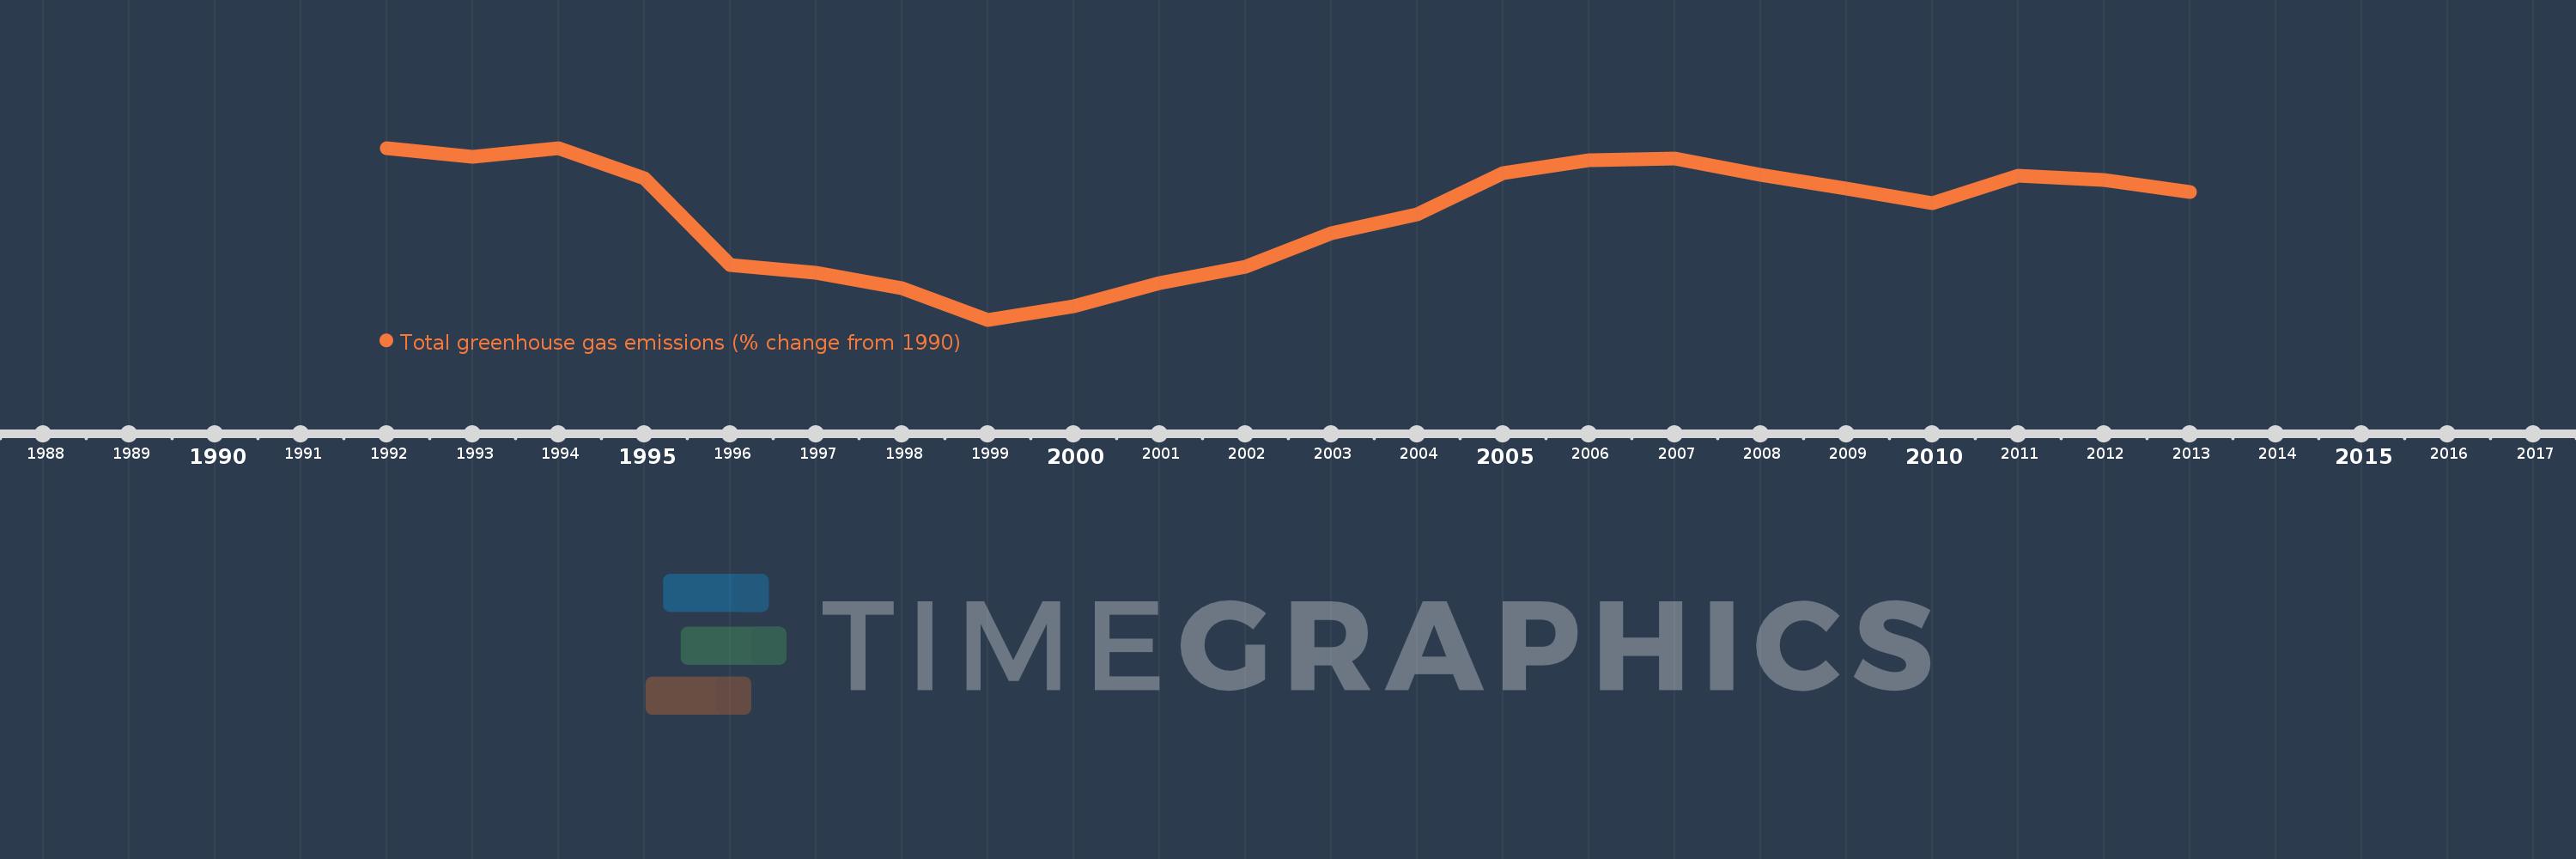
Questa scala temporale mostra un grafico dal 1992 anno al 2013 anno. Luxembourg. I dati fino ad 1991 anno non disponibili. Il numero di osservazioni attuali secondo i date: 22.
La fonte (nome):
Indicatori dello sviluppo mondiale
La fonte (organizzazione):
World Bank staff estimates from original source: European Commission, Joint Research Centre (JRC)/Netherlands Environmental Assessment Agency (PBL). Emission Database for Global Atmospheric Research (EDGAR): http://edgar.jrc.ec.europa.eu/.
Categorie:
Climate Change, Environment
sono stati aggiornati
23 apr 2017 anni
Indicatori delle variazioni dei valori per anni
In media:
-7.804
Minima:
-28.804
1 gen 1999 anni
Massimo:
5.007
1 gen 1994 anni
Alla data di osservazione
Valore
Variazione assoluta
La variazione rispetto al valore precedente
1 gen 1992 anni
4.965
+4.965
0.0%
1 gen 1993 anni
3.296
-1.669
-33.61%
1 gen 1994 anni
5.007
+1.711
51.91%
1 gen 1995 anni
-0.954
-5.961
-119.04%
1 gen 1996 anni
-18.112
-17.159
1.8 Mille.%
1 gen 1997 anni
-19.638
-1.526
8.42%
1 gen 1998 anni
-22.641
-3.003
15.29%
1 gen 1999 anni
-28.804
-6.163
27.22%
1 gen 2000 anni
-26.093
+2.711
-9.41%
1 gen 2001 anni
-21.627
+4.466
-17.11%
1 gen 2002 anni
-18.324
+3.303
-15.27%
1 gen 2003 anni
-11.79
+6.534
-35.66%
1 gen 2004 anni
-8.05
+3.74
-31.72%
1 gen 2005 anni
0.106
+8.157
-101.32%
1 gen 2006 anni
2.624
+2.518
2.37 Mille.%
1 gen 2007 anni
2.989
+0.365
13.91%
1 gen 2008 anni
-0.226
-3.215
-107.54%
1 gen 2009 anni
-3.05
-2.825
1.25 Mille.%
1 gen 2010 anni
-5.79
-2.74
89.84%
1 gen 2011 anni
-0.513
+5.278
-91.15%
1 gen 2012 anni
-1.316
-0.804
156.73%
1 gen 2013 anni
-3.747
-2.431
184.72%
Classificazione dei paesi secondo i statistiche attuali per anni
