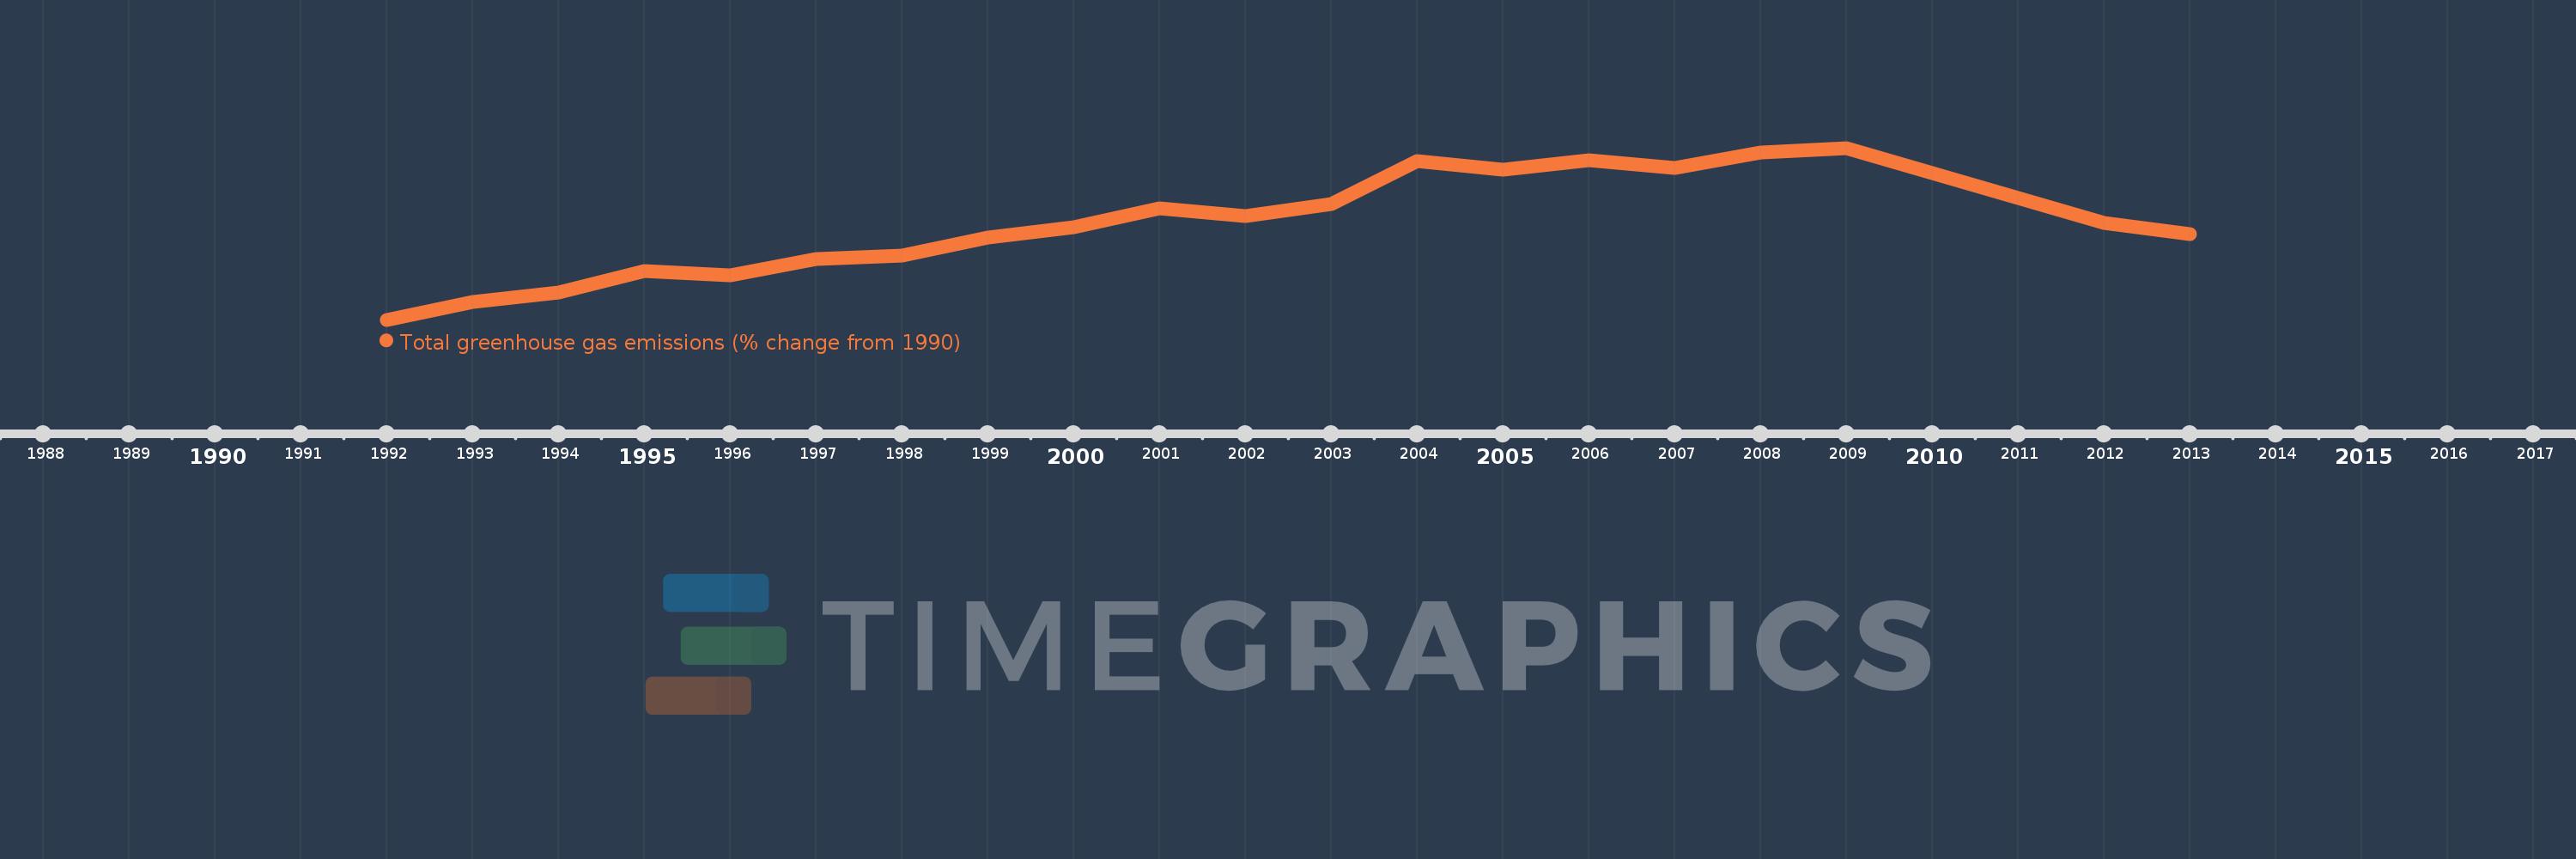
Questa scala temporale mostra un grafico dal 1992 anno al 2013 anno. Cyprus. I dati fino ad 1991 anno non disponibili. Il numero di osservazioni attuali secondo i date: 20.
La fonte (nome):
Indicatori dello sviluppo mondiale
La fonte (organizzazione):
World Bank staff estimates from original source: European Commission, Joint Research Centre (JRC)/Netherlands Environmental Assessment Agency (PBL). Emission Database for Global Atmospheric Research (EDGAR): http://edgar.jrc.ec.europa.eu/.
Categorie:
Climate Change, Environment
sono stati aggiornati
23 apr 2017 anni
Indicatori delle variazioni dei valori per anni
In media:
48.721
Minima:
11.232
1 gen 1992 anni
Massimo:
78.661
1 gen 2009 anni
Alla data di osservazione
Valore
Variazione assoluta
La variazione rispetto al valore precedente
1 gen 1992 anni
11.232
+11.232
0.0%
1 gen 1993 anni
18.345
+7.113
63.33%
1 gen 1994 anni
22.069
+3.724
20.3%
1 gen 1995 anni
30.454
+8.384
37.99%
1 gen 1996 anni
28.534
-1.92
-6.3%
1 gen 1997 anni
35.11
+6.577
23.05%
1 gen 1998 anni
36.527
+1.417
4.03%
1 gen 1999 anni
43.365
+6.838
18.72%
1 gen 2000 anni
47.611
+4.246
9.79%
1 gen 2001 anni
55.014
+7.403
15.55%
1 gen 2002 anni
51.858
-3.155
-5.74%
1 gen 2003 anni
56.73
+4.872
9.39%
1 gen 2004 anni
73.412
+16.682
29.41%
1 gen 2005 anni
70.072
-3.34
-4.55%
1 gen 2006 anni
73.705
+3.633
5.18%
1 gen 2007 anni
70.785
-2.92
-3.96%
1 gen 2008 anni
76.933
+6.148
8.69%
1 gen 2009 anni
78.661
+1.729
2.25%
1 gen 2012 anni
49.158
-29.503
-37.51%
1 gen 2013 anni
44.847
-4.31
-8.77%
Classificazione dei paesi secondo i statistiche attuali per anni
