29
/it/
it
AIzaSyAYiBZKx7MnpbEhh9jyipgxe19OcubqV5w
April 1, 2024
169839
Korea, Rep.
KOR
true
2
1
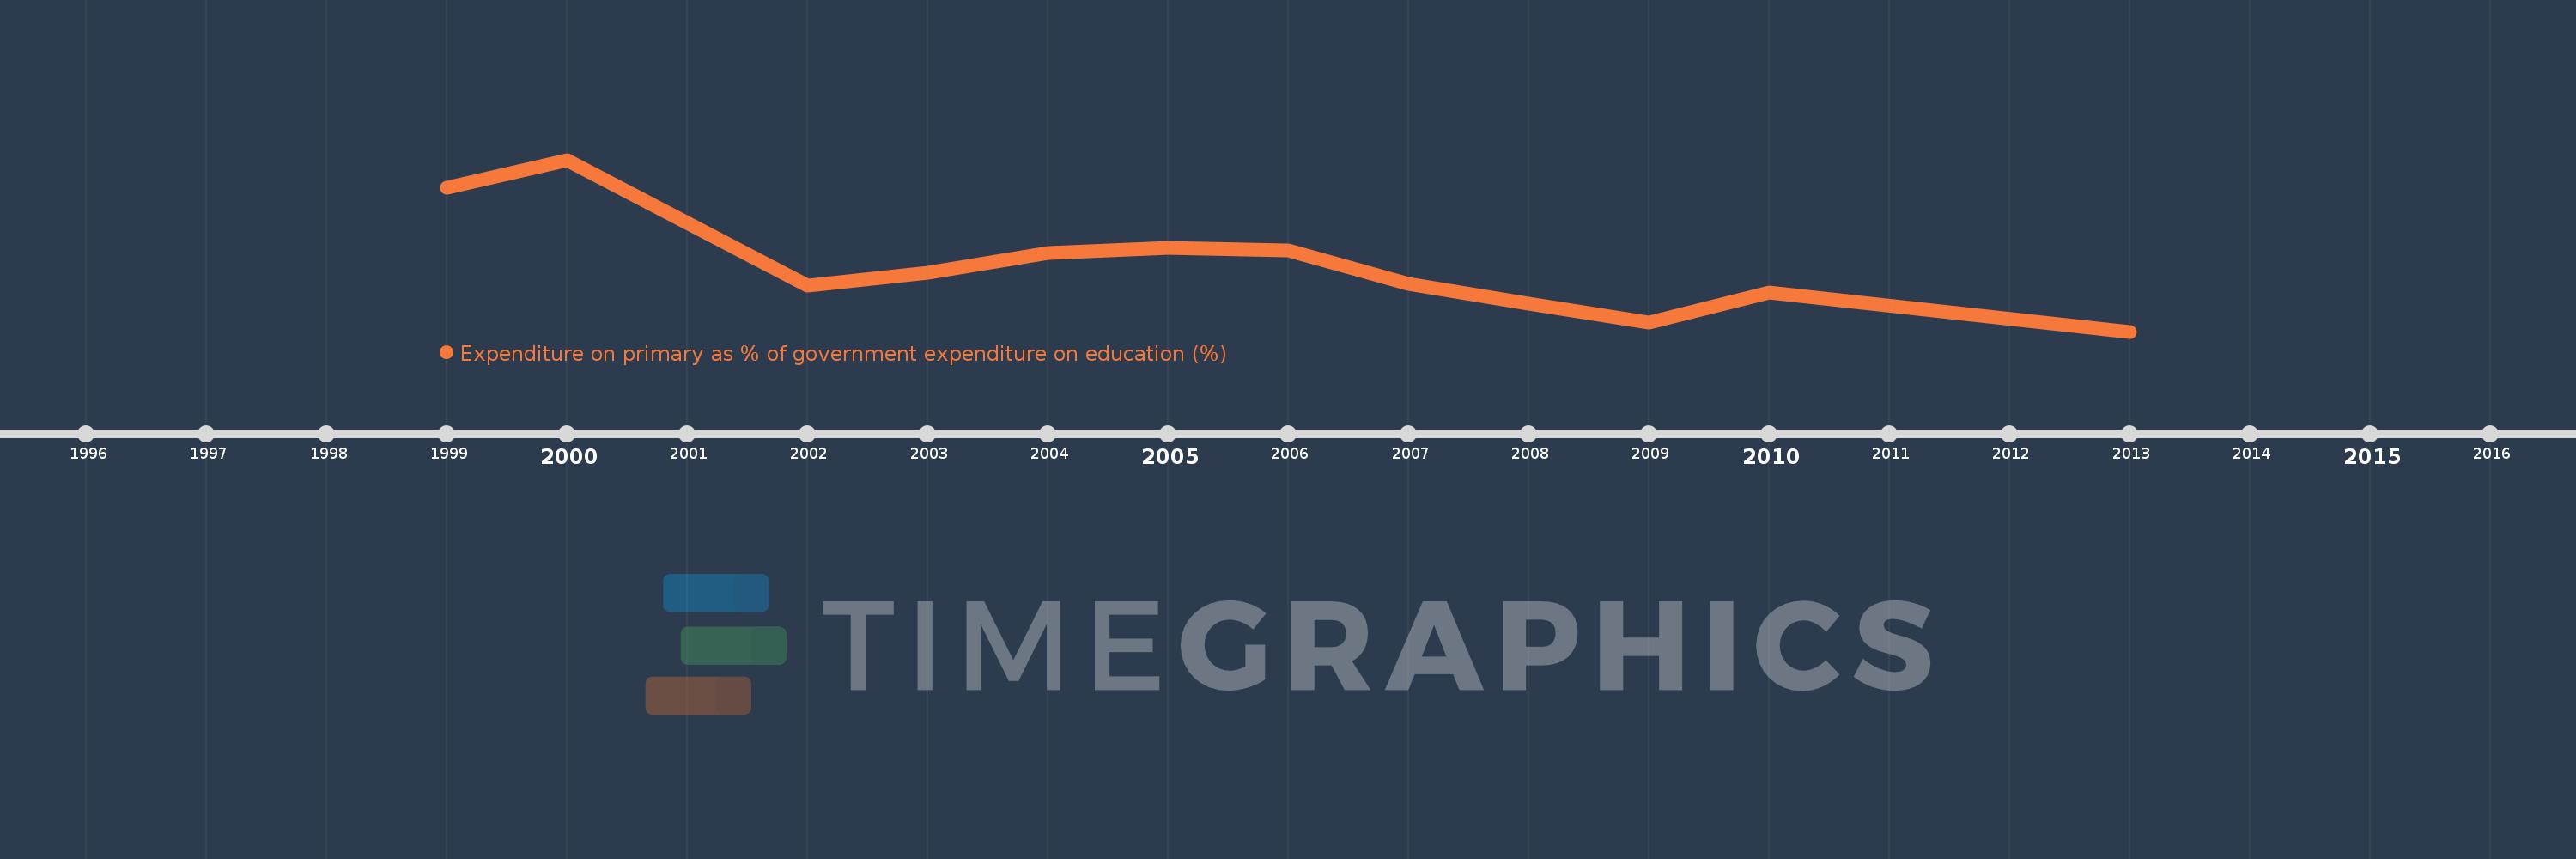
Expenditure on primary as % of government expenditure on education (%)
2013,2010,2009,2008,2007,2006,2005,2004,2003,2002,2000,1999
Queste statistiche in altri paesi:
Linea del tempo:
Questa scala temporale mostra un grafico dal 1999 anno al 2013 anno. Korea, Rep.. I dati fino ad 1998 anno non disponibili. Il numero di osservazioni attuali secondo i date: 12.
La fonte (nome):
Indicatori dello sviluppo mondiale
La fonte (organizzazione):
UNESCO Institute for Statistics
Categorie:
Education
sono stati aggiornati
23 apr 2017 anni
Indicatori delle variazioni dei valori per anni
Minima:
30.031
1 gen 2013 anni
Massimo:
41.425
1 gen 2000 anni
Alla data di osservazione
Valore
Variazione assoluta
La variazione rispetto al valore precedente
1 gen 1999 anni
39.587
+39.587
0.0%
1 gen 2000 anni
41.425
+1.837
4.64%
1 gen 2002 anni
33.073
-8.352
-20.16%
1 gen 2003 anni
33.96
+0.887
2.68%
1 gen 2004 anni
35.238
+1.278
3.76%
1 gen 2005 anni
35.586
+0.348
0.99%
1 gen 2006 anni
35.397
-0.189
-0.53%
1 gen 2007 anni
33.174
-2.223
-6.28%
1 gen 2008 anni
31.864
-1.309
-3.95%
1 gen 2009 anni
30.629
-1.236
-3.88%
1 gen 2010 anni
32.635
+2.006
6.55%
1 gen 2013 anni
30.031
-2.604
-7.98%
Classificazione dei paesi secondo i statistiche attuali per anni


Commenti: