29
/es/
es
AIzaSyAYiBZKx7MnpbEhh9jyipgxe19OcubqV5w
April 1, 2024
169839
Korea, Rep.
KOR
true
2
1
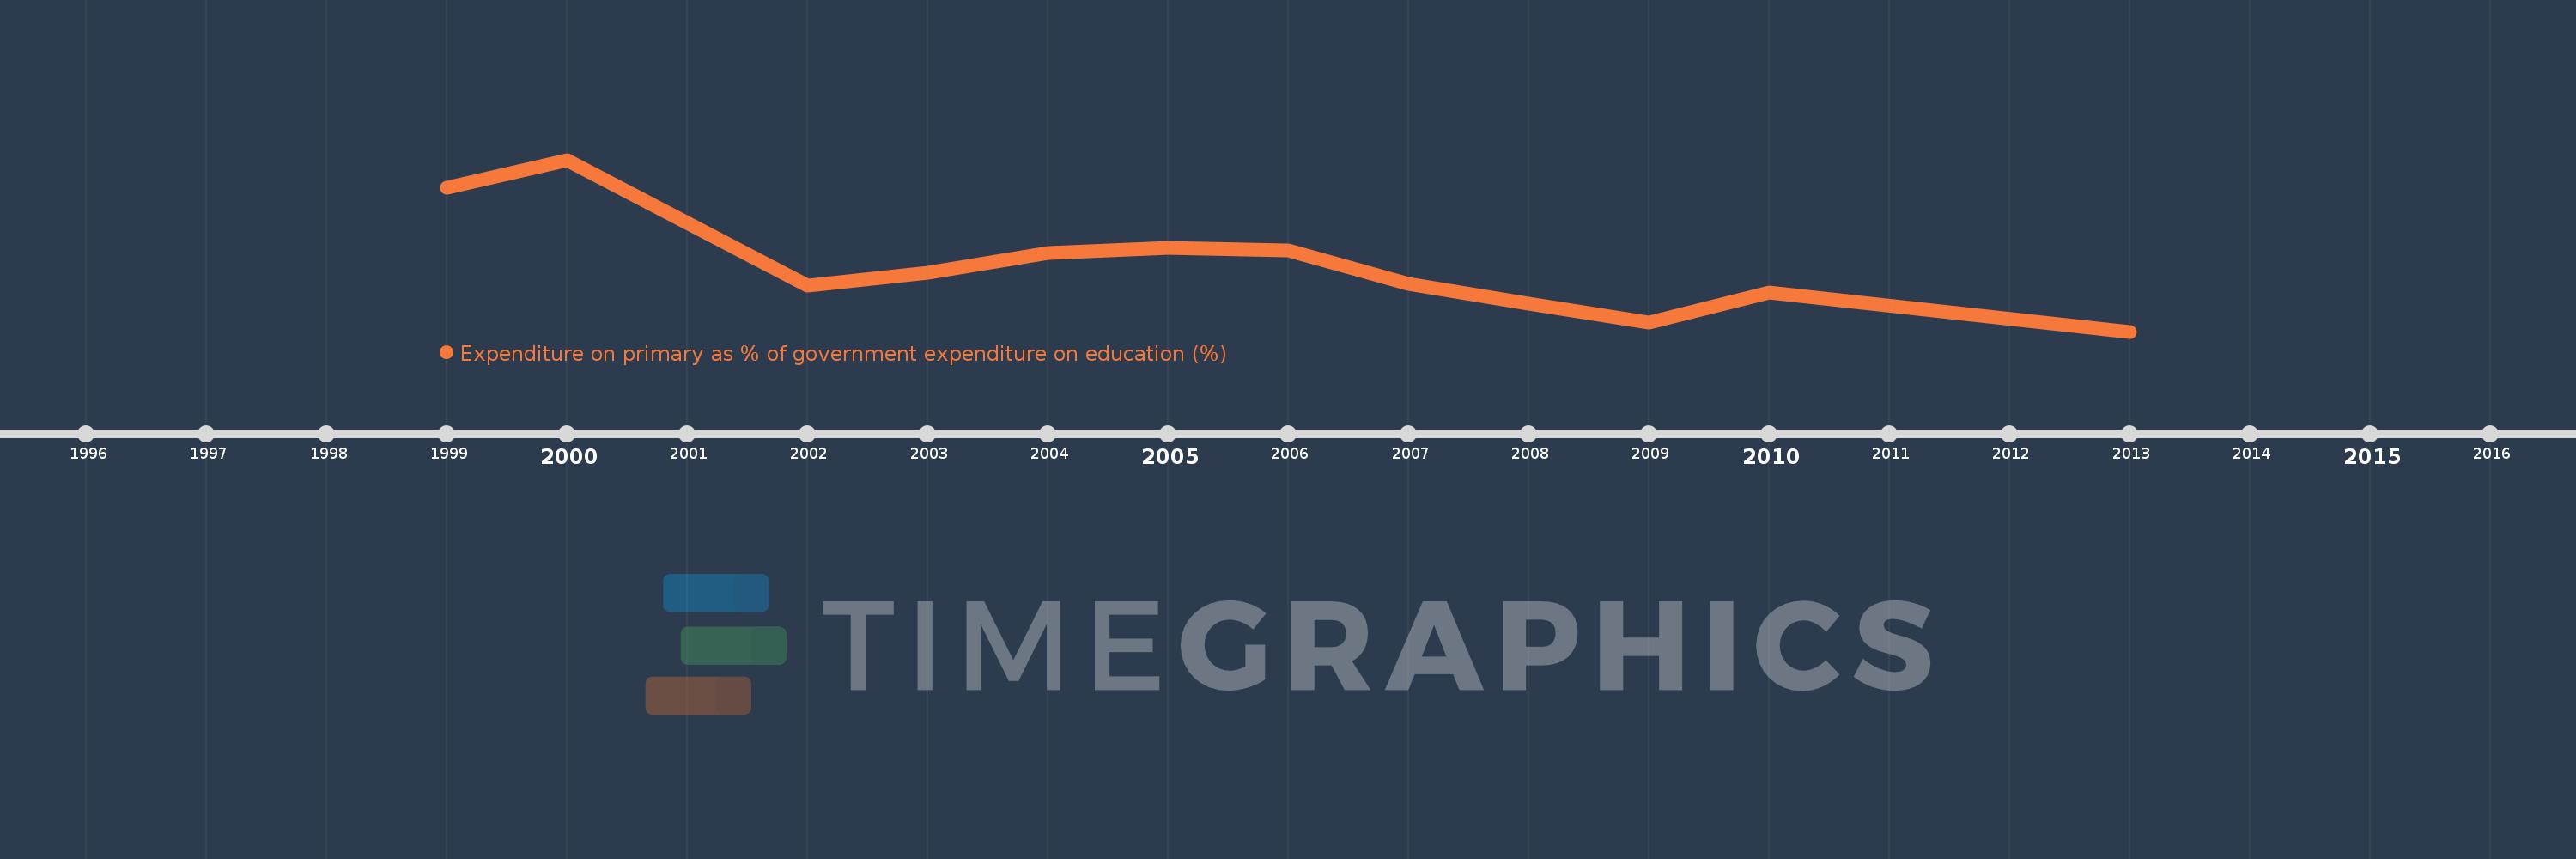
Expenditure on primary as % of government expenditure on education (%)
2013,2010,2009,2008,2007,2006,2005,2004,2003,2002,2000,1999
Estas estadísticas en otros países:
línea de tiempo (timeline):
En esta escala de tiempo se presenta un gráfico de 1999 y 2013 de Korea, Rep.. Los datos de 1998 están ausentes. El número de observaciones reales por fecha: 12.
Fuente (nombre):
Indicadores del desarrollo mundial
Fuente (organización):
UNESCO Institute for Statistics
Categorías:
Education
Se ha actualizado:
23 abr 2017 año
Los indicadores de los cambios de valor en los últimos años
Mínimo:
30.031
1 ene 2013 año
Máximo:
41.425
1 ene 2000 año
A la fecha de observación
Valor
Cambio absoluto
El cambio con respecto al valor anterior
1 ene 1999 año
39.587
+39.587
0.0%
1 ene 2000 año
41.425
+1.837
4.64%
1 ene 2002 año
33.073
-8.352
-20.16%
1 ene 2003 año
33.96
+0.887
2.68%
1 ene 2004 año
35.238
+1.278
3.76%
1 ene 2005 año
35.586
+0.348
0.99%
1 ene 2006 año
35.397
-0.189
-0.53%
1 ene 2007 año
33.174
-2.223
-6.28%
1 ene 2008 año
31.864
-1.309
-3.95%
1 ene 2009 año
30.629
-1.236
-3.88%
1 ene 2010 año
32.635
+2.006
6.55%
1 ene 2013 año
30.031
-2.604
-7.98%
Ranking de los países por los datos estadísticos actuales


Comentarios: