29
/it/
it
AIzaSyAYiBZKx7MnpbEhh9jyipgxe19OcubqV5w
April 1, 2024
142077
Greece
GRC
true
2
1
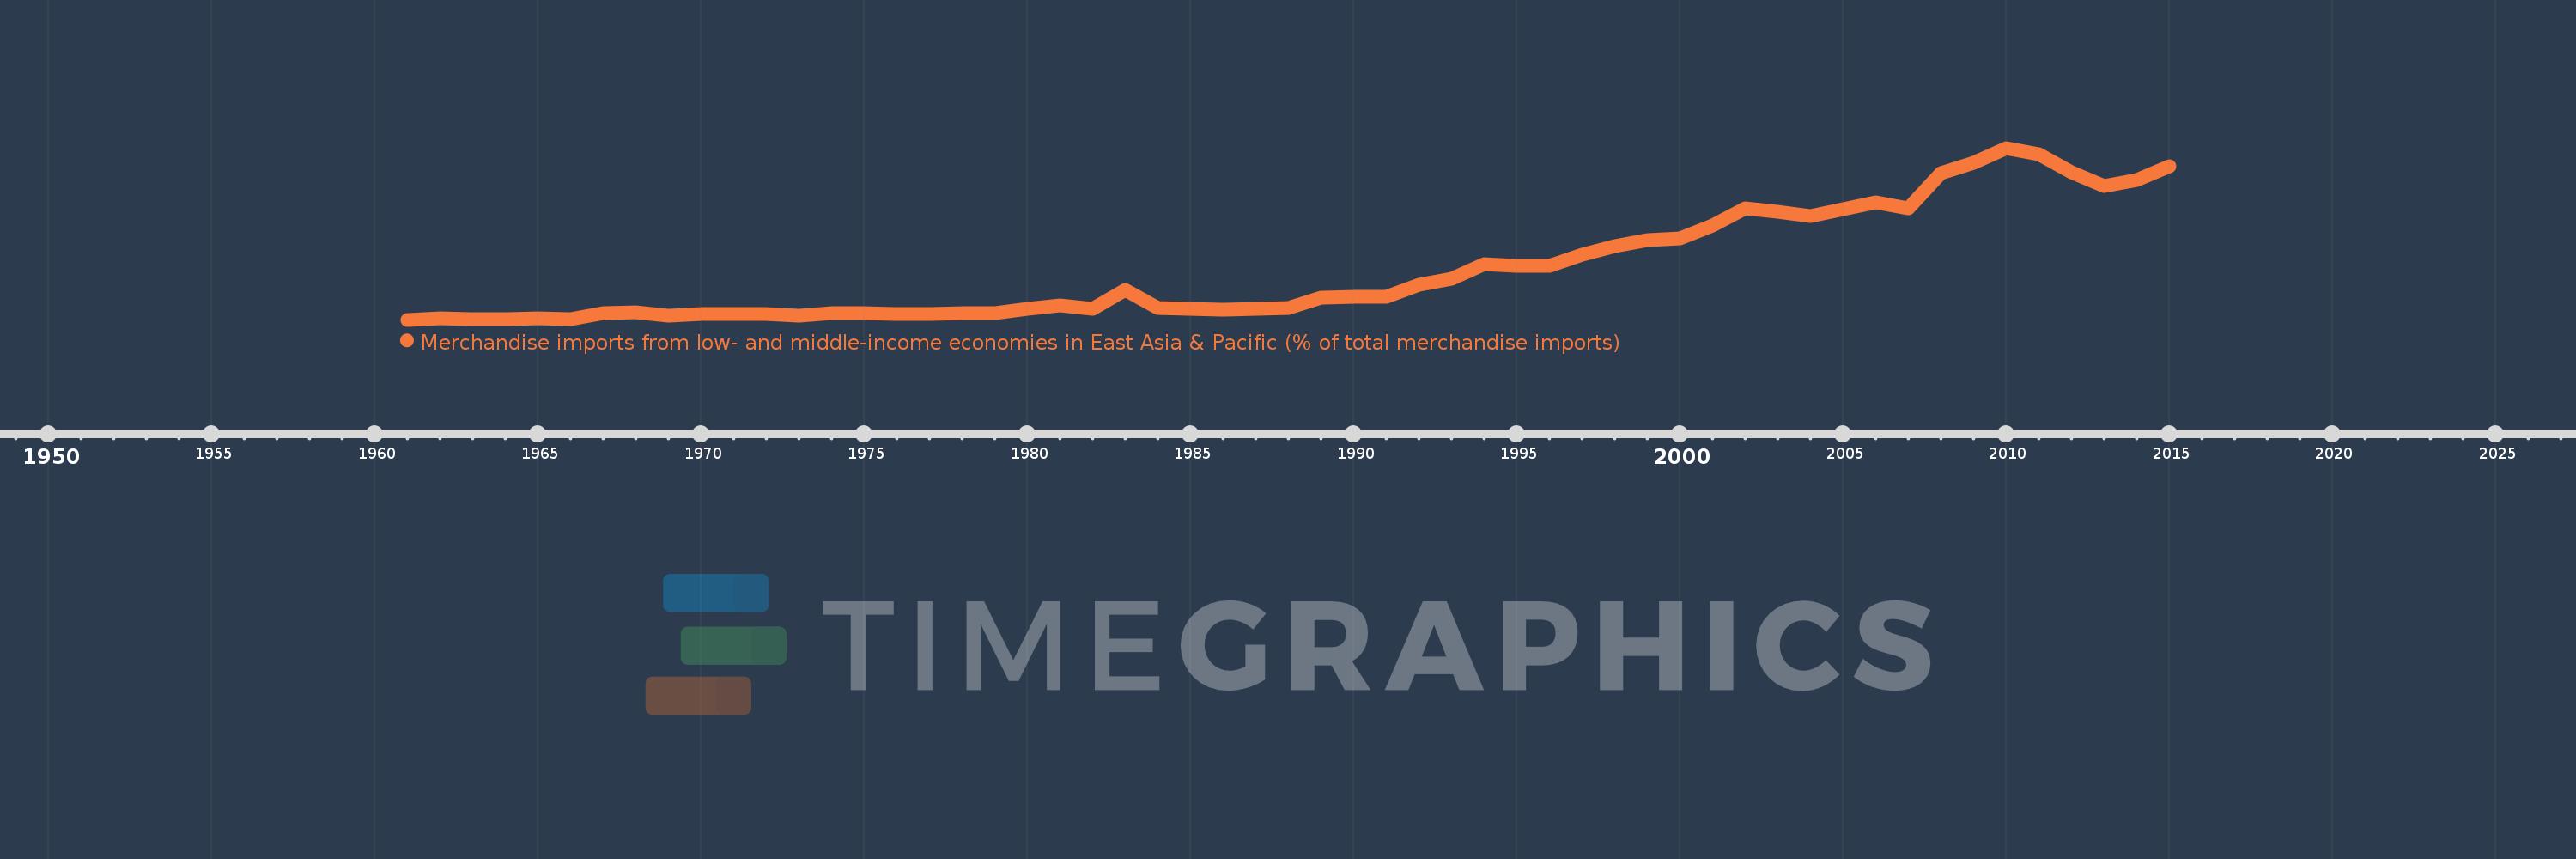
Merchandise imports from low- and middle-income economies in East Asia & Pacific (% of total merchandise imports)
2015,2014,2013,2012,2011,2010,2009,2008,2007,2006,2005,2004,2003,2002,2001,2000,1999,1998,1997,1996,1995,1994,1993,1992,1991,1990,1989,1988,1987,1986,1985,1984,1983,1982,1981,1980,1979,1978,1977,1976,1975,1974,1973,1972,1971,1970,1969,1968,1967,1966,1965,1964,1963,1962,1961
Queste statistiche in altri paesi:
AfghanistanAlbaniaAlgeriaArab WorldArgentinaArmeniaArubaAustraliaAustriaAzerbaijanBahamas, TheBahrainBangladeshBarbadosBelarusBelgiumBelizeBeninBermudaBoliviaBrazilBrunei DarussalamBulgariaBurkina FasoBurundiCabo VerdeCambodiaCameroonCanadaCaribbean small statesCentral African RepublicCentral Europe and the BalticsChileChinaColombiaCongo, Rep.Costa RicaCote d'IvoireCroatiaCyprusCzech RepublicDenmarkDominicaDominican RepublicEarly-demographic dividendEast Asia & PacificEast Asia & Pacific (excluding high income)East Asia & Pacific (IDA & IBRD countries)EcuadorEgypt, Arab Rep.El SalvadorEstoniaEthiopiaEuro areaEurope & Central AsiaEurope & Central Asia (excluding high income)Europe & Central Asia (IDA & IBRD countries)European UnionFijiFinlandFragile and conflict affected situationsFranceFrench PolynesiaGabonGambia, TheGeorgiaGermanyGhanaGreeceGreenlandGrenadaGuatemalaHaitiHeavily indebted poor countries (HIPC)High incomeHondurasHong Kong SAR, ChinaHungaryIBRD onlyIcelandIDA & IBRD totalIDA blendIDA onlyIDA totalIndiaIndonesiaIran, Islamic Rep.IraqIrelandIsraelItalyJamaicaJapanJordanKazakhstanKenyaKorea, Dem. People’s Rep.Korea, Rep.KuwaitKyrgyz RepublicLao PDRLate-demographic dividendLatin America & Caribbean Latin America & Caribbean (excluding high income)Latin America & the Caribbean (IDA & IBRD countries)LatviaLeast developed countries: UN classificationLebanonLithuaniaLow & middle incomeLow incomeLower middle incomeLuxembourgMacao SAR, ChinaMacedonia, FYRMadagascarMalaysiaMaliMaltaMauritiusMexicoMiddle East & North AfricaMiddle East & North Africa (excluding high income)Middle East & North Africa (IDA & IBRD countries)Middle incomeMoldovaMongoliaMontenegroMoroccoMyanmarNetherlandsNew CaledoniaNew ZealandNicaraguaNigerNigeriaNorth AmericaNorwayOECD membersOmanOther small statesPacific island small statesPakistanPanamaPapua New GuineaParaguayPeruPhilippinesPolandPortugalPost-demographic dividendPre-demographic dividendQatarRomaniaRussian FederationSamoaSaudi ArabiaSenegalSerbiaSingaporeSlovak RepublicSloveniaSmall statesSolomon IslandsSomaliaSouth AfricaSouth AsiaSouth Asia (IDA & IBRD)SpainSri LankaSt. Kitts and NevisSt. LuciaSt. Vincent and the GrenadinesSub-Saharan Africa Sub-Saharan Africa (excluding high income)Sub-Saharan Africa (IDA & IBRD countries)SurinameSwedenSwitzerlandTanzaniaThailandTogoTongaTrinidad and TobagoTunisiaTurkeyUgandaUkraineUnited Arab EmiratesUnited KingdomUnited StatesUpper middle incomeUruguayVanuatuVenezuela, RBVietnamWorldYemen, Rep.ZambiaZimbabwe Linea del tempo:
Questa scala temporale mostra un grafico dal 1961 anno al 2015 anno. Greece. I dati fino ad 1960 anno non disponibili. Il numero di osservazioni attuali secondo i date: 55.
La fonte (nome):
Indicatori dello sviluppo mondiale
La fonte (organizzazione):
World Bank staff estimates based data from International Monetary Fund's Direction of Trade database.
Categorie:
Private Sector, Trade
sono stati aggiornati
23 apr 2017 anni
Indicatori delle variazioni dei valori per anni
Minima:
0.043
1 gen 1961 anni
Massimo:
6.875
1 gen 2010 anni
Alla data di osservazione
Valore
Variazione assoluta
La variazione rispetto al valore precedente
1 gen 1961 anni
0.043
+0.043
0.0%
1 gen 1962 anni
0.084
+0.041
96.57%
1 gen 1963 anni
0.072
-0.013
-14.98%
1 gen 1964 anni
0.075
+0.003
4.68%
1 gen 1965 anni
0.091
+0.016
20.64%
1 gen 1966 anni
0.079
-0.011
-12.46%
1 gen 1967 anni
0.321
+0.242
304.71%
1 gen 1968 anni
0.346
+0.025
7.66%
1 gen 1969 anni
0.2
-0.145
-42.06%
1 gen 1970 anni
0.27
+0.07
34.93%
1 gen 1971 anni
0.26
-0.01
-3.86%
1 gen 1972 anni
0.258
-0.002
-0.62%
1 gen 1973 anni
0.22
-0.039
-15.0%
1 gen 1974 anni
0.309
+0.089
40.56%
1 gen 1975 anni
0.313
+0.005
1.53%
1 gen 1976 anni
0.256
-0.058
-18.45%
1 gen 1977 anni
0.27
+0.014
5.51%
1 gen 1978 anni
0.304
+0.034
12.61%
1 gen 1979 anni
0.322
+0.019
6.15%
1 gen 1980 anni
0.471
+0.149
46.17%
1 gen 1981 anni
0.609
+0.138
29.36%
1 gen 1982 anni
0.479
-0.131
-21.44%
1 gen 1983 anni
1.226
+0.748
156.15%
1 gen 1984 anni
0.5
-0.726
-59.22%
1 gen 1985 anni
0.488
-0.012
-2.41%
1 gen 1986 anni
0.433
-0.055
-11.21%
1 gen 1987 anni
0.483
+0.05
11.43%
1 gen 1988 anni
0.526
+0.043
8.9%
1 gen 1989 anni
0.927
+0.401
76.35%
1 gen 1990 anni
0.953
+0.026
2.76%
1 gen 1991 anni
0.962
+0.009
0.95%
1 gen 1992 anni
1.439
+0.477
49.58%
1 gen 1993 anni
1.679
+0.24
16.69%
1 gen 1994 anni
2.246
+0.567
33.74%
1 gen 1995 anni
2.194
-0.052
-2.29%
1 gen 1996 anni
2.178
-0.017
-0.76%
1 gen 1997 anni
2.645
+0.468
21.47%
1 gen 1998 anni
2.966
+0.32
12.1%
1 gen 1999 anni
3.211
+0.246
8.29%
1 gen 2000 anni
3.281
+0.07
2.18%
1 gen 2001 anni
3.774
+0.492
15.01%
1 gen 2002 anni
4.486
+0.713
18.89%
1 gen 2003 anni
4.326
-0.161
-3.59%
1 gen 2004 anni
4.172
-0.154
-3.56%
1 gen 2005 anni
4.456
+0.284
6.81%
1 gen 2006 anni
4.711
+0.255
5.72%
1 gen 2007 anni
4.462
-0.249
-5.28%
1 gen 2008 anni
5.874
+1.412
31.65%
1 gen 2009 anni
6.286
+0.412
7.01%
1 gen 2010 anni
6.875
+0.589
9.38%
1 gen 2011 anni
6.622
-0.253
-3.68%
1 gen 2012 anni
5.892
-0.73
-11.03%
1 gen 2013 anni
5.36
-0.533
-9.04%
1 gen 2014 anni
5.598
+0.238
4.44%
1 gen 2015 anni
6.157
+0.56
10.0%
Classificazione dei paesi secondo i statistiche attuali per anni


Commenti: