29
/it/
it
AIzaSyAYiBZKx7MnpbEhh9jyipgxe19OcubqV5w
April 1, 2024
107550
Colombia
COL
true
2
1
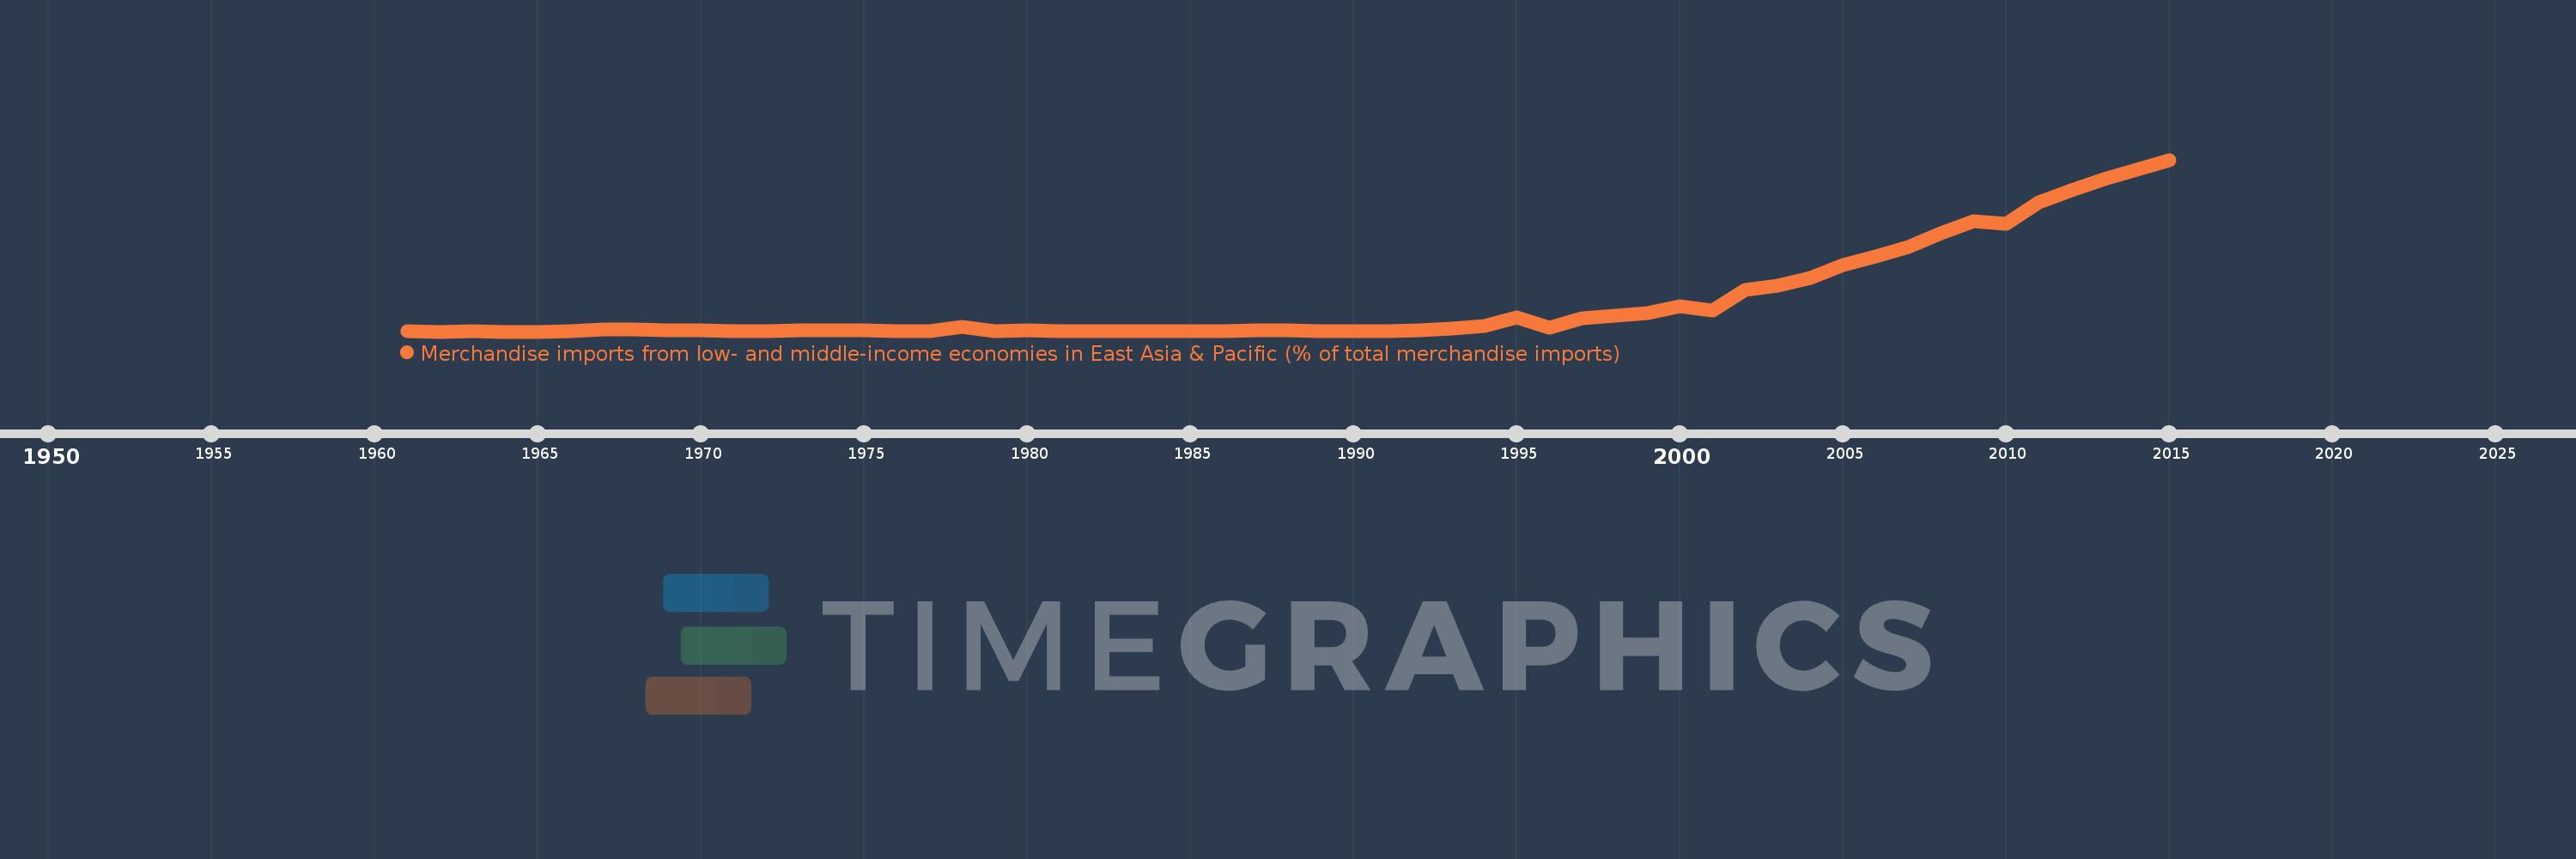
Merchandise imports from low- and middle-income economies in East Asia & Pacific (% of total merchandise imports)
2015,2014,2013,2012,2011,2010,2009,2008,2007,2006,2005,2004,2003,2002,2001,2000,1999,1998,1997,1996,1995,1994,1993,1992,1991,1990,1989,1988,1987,1986,1985,1984,1983,1982,1981,1980,1979,1978,1977,1976,1975,1974,1973,1972,1971,1970,1969,1968,1967,1966,1965,1964,1963,1962,1961
Queste statistiche in altri paesi:
AfghanistanAlbaniaAlgeriaArab WorldArgentinaArmeniaArubaAustraliaAustriaAzerbaijanBahamas, TheBahrainBangladeshBarbadosBelarusBelgiumBelizeBeninBermudaBoliviaBrazilBrunei DarussalamBulgariaBurkina FasoBurundiCabo VerdeCambodiaCameroonCanadaCaribbean small statesCentral African RepublicCentral Europe and the BalticsChileChinaColombiaCongo, Rep.Costa RicaCote d'IvoireCroatiaCyprusCzech RepublicDenmarkDominicaDominican RepublicEarly-demographic dividendEast Asia & PacificEast Asia & Pacific (excluding high income)East Asia & Pacific (IDA & IBRD countries)EcuadorEgypt, Arab Rep.El SalvadorEstoniaEthiopiaEuro areaEurope & Central AsiaEurope & Central Asia (excluding high income)Europe & Central Asia (IDA & IBRD countries)European UnionFijiFinlandFragile and conflict affected situationsFranceFrench PolynesiaGabonGambia, TheGeorgiaGermanyGhanaGreeceGreenlandGrenadaGuatemalaHaitiHeavily indebted poor countries (HIPC)High incomeHondurasHong Kong SAR, ChinaHungaryIBRD onlyIcelandIDA & IBRD totalIDA blendIDA onlyIDA totalIndiaIndonesiaIran, Islamic Rep.IraqIrelandIsraelItalyJamaicaJapanJordanKazakhstanKenyaKorea, Dem. People’s Rep.Korea, Rep.KuwaitKyrgyz RepublicLao PDRLate-demographic dividendLatin America & Caribbean Latin America & Caribbean (excluding high income)Latin America & the Caribbean (IDA & IBRD countries)LatviaLeast developed countries: UN classificationLebanonLithuaniaLow & middle incomeLow incomeLower middle incomeLuxembourgMacao SAR, ChinaMacedonia, FYRMadagascarMalaysiaMaliMaltaMauritiusMexicoMiddle East & North AfricaMiddle East & North Africa (excluding high income)Middle East & North Africa (IDA & IBRD countries)Middle incomeMoldovaMongoliaMontenegroMoroccoMyanmarNetherlandsNew CaledoniaNew ZealandNicaraguaNigerNigeriaNorth AmericaNorwayOECD membersOmanOther small statesPacific island small statesPakistanPanamaPapua New GuineaParaguayPeruPhilippinesPolandPortugalPost-demographic dividendPre-demographic dividendQatarRomaniaRussian FederationSamoaSaudi ArabiaSenegalSerbiaSingaporeSlovak RepublicSloveniaSmall statesSolomon IslandsSomaliaSouth AfricaSouth AsiaSouth Asia (IDA & IBRD)SpainSri LankaSt. Kitts and NevisSt. LuciaSt. Vincent and the GrenadinesSub-Saharan Africa Sub-Saharan Africa (excluding high income)Sub-Saharan Africa (IDA & IBRD countries)SurinameSwedenSwitzerlandTanzaniaThailandTogoTongaTrinidad and TobagoTunisiaTurkeyUgandaUkraineUnited Arab EmiratesUnited KingdomUnited StatesUpper middle incomeUruguayVanuatuVenezuela, RBVietnamWorldYemen, Rep.ZambiaZimbabwe Linea del tempo:
Questa scala temporale mostra un grafico dal 1961 anno al 2015 anno. Colombia. I dati fino ad 1960 anno non disponibili. Il numero di osservazioni attuali secondo i date: 55.
La fonte (nome):
Indicatori dello sviluppo mondiale
La fonte (organizzazione):
World Bank staff estimates based data from International Monetary Fund's Direction of Trade database.
Categorie:
Private Sector, Trade
sono stati aggiornati
23 apr 2017 anni
Indicatori delle variazioni dei valori per anni
Minima:
0.0
1 gen 1962 anni
Massimo:
20.492
1 gen 2015 anni
Alla data di osservazione
Valore
Variazione assoluta
La variazione rispetto al valore precedente
1 gen 1961 anni
0.058
+0.058
0.0%
1 gen 1962 anni
0.0
-0.058
-100.0%
1 gen 1963 anni
0.093
+0.093
%
1 gen 1964 anni
0.0
-0.093
-100.0%
1 gen 1966 anni
0.066
+0.066
%
1 gen 1967 anni
0.297
+0.23
346.92%
1 gen 1968 anni
0.302
+0.005
1.85%
1 gen 1969 anni
0.175
-0.127
-41.94%
1 gen 1970 anni
0.197
+0.022
12.3%
1 gen 1971 anni
0.037
-0.16
-81.35%
1 gen 1972 anni
0.075
+0.039
105.05%
1 gen 1973 anni
0.119
+0.043
57.67%
1 gen 1974 anni
0.136
+0.017
14.15%
1 gen 1975 anni
0.114
-0.022
-15.94%
1 gen 1976 anni
0.086
-0.028
-24.26%
1 gen 1977 anni
0.046
-0.04
-46.4%
1 gen 1978 anni
0.514
+0.468
1.01 Mille.%
1 gen 1979 anni
0.062
-0.453
-88.0%
1 gen 1980 anni
0.103
+0.042
67.43%
1 gen 1981 anni
0.088
-0.015
-14.67%
1 gen 1982 anni
0.07
-0.018
-20.36%
1 gen 1983 anni
0.075
+0.005
7.14%
1 gen 1984 anni
0.08
+0.005
6.78%
1 gen 1985 anni
0.078
-0.002
-2.44%
1 gen 1986 anni
0.04
-0.038
-49.02%
1 gen 1987 anni
0.122
+0.082
204.44%
1 gen 1988 anni
0.163
+0.041
33.83%
1 gen 1989 anni
0.067
-0.096
-58.83%
1 gen 1990 anni
0.089
+0.022
32.63%
1 gen 1991 anni
0.083
-0.006
-7.01%
1 gen 1992 anni
0.169
+0.087
104.8%
1 gen 1993 anni
0.396
+0.227
134.07%
1 gen 1994 anni
0.689
+0.293
73.86%
1 gen 1995 anni
1.709
+1.02
148.11%
1 gen 1996 anni
0.492
-1.217
-71.2%
1 gen 1997 anni
1.614
+1.122
228.02%
1 gen 1998 anni
1.895
+0.28
17.37%
1 gen 1999 anni
2.224
+0.329
17.35%
1 gen 2000 anni
2.997
+0.773
34.79%
1 gen 2001 anni
2.486
-0.511
-17.06%
1 gen 2002 anni
5.002
+2.516
101.23%
1 gen 2003 anni
5.498
+0.496
9.91%
1 gen 2004 anni
6.441
+0.943
17.15%
1 gen 2005 anni
7.93
+1.489
23.13%
1 gen 2006 anni
9.012
+1.082
13.64%
1 gen 2007 anni
10.136
+1.124
12.47%
1 gen 2008 anni
11.731
+1.595
15.74%
1 gen 2009 anni
13.215
+1.484
12.65%
1 gen 2010 anni
12.886
-0.33
-2.49%
1 gen 2011 anni
15.381
+2.495
19.36%
1 gen 2012 anni
16.869
+1.488
9.67%
1 gen 2013 anni
18.149
+1.281
7.59%
1 gen 2014 anni
19.328
+1.179
6.5%
1 gen 2015 anni
20.492
+1.163
6.02%
Classificazione dei paesi secondo i statistiche attuali per anni


Commenti: