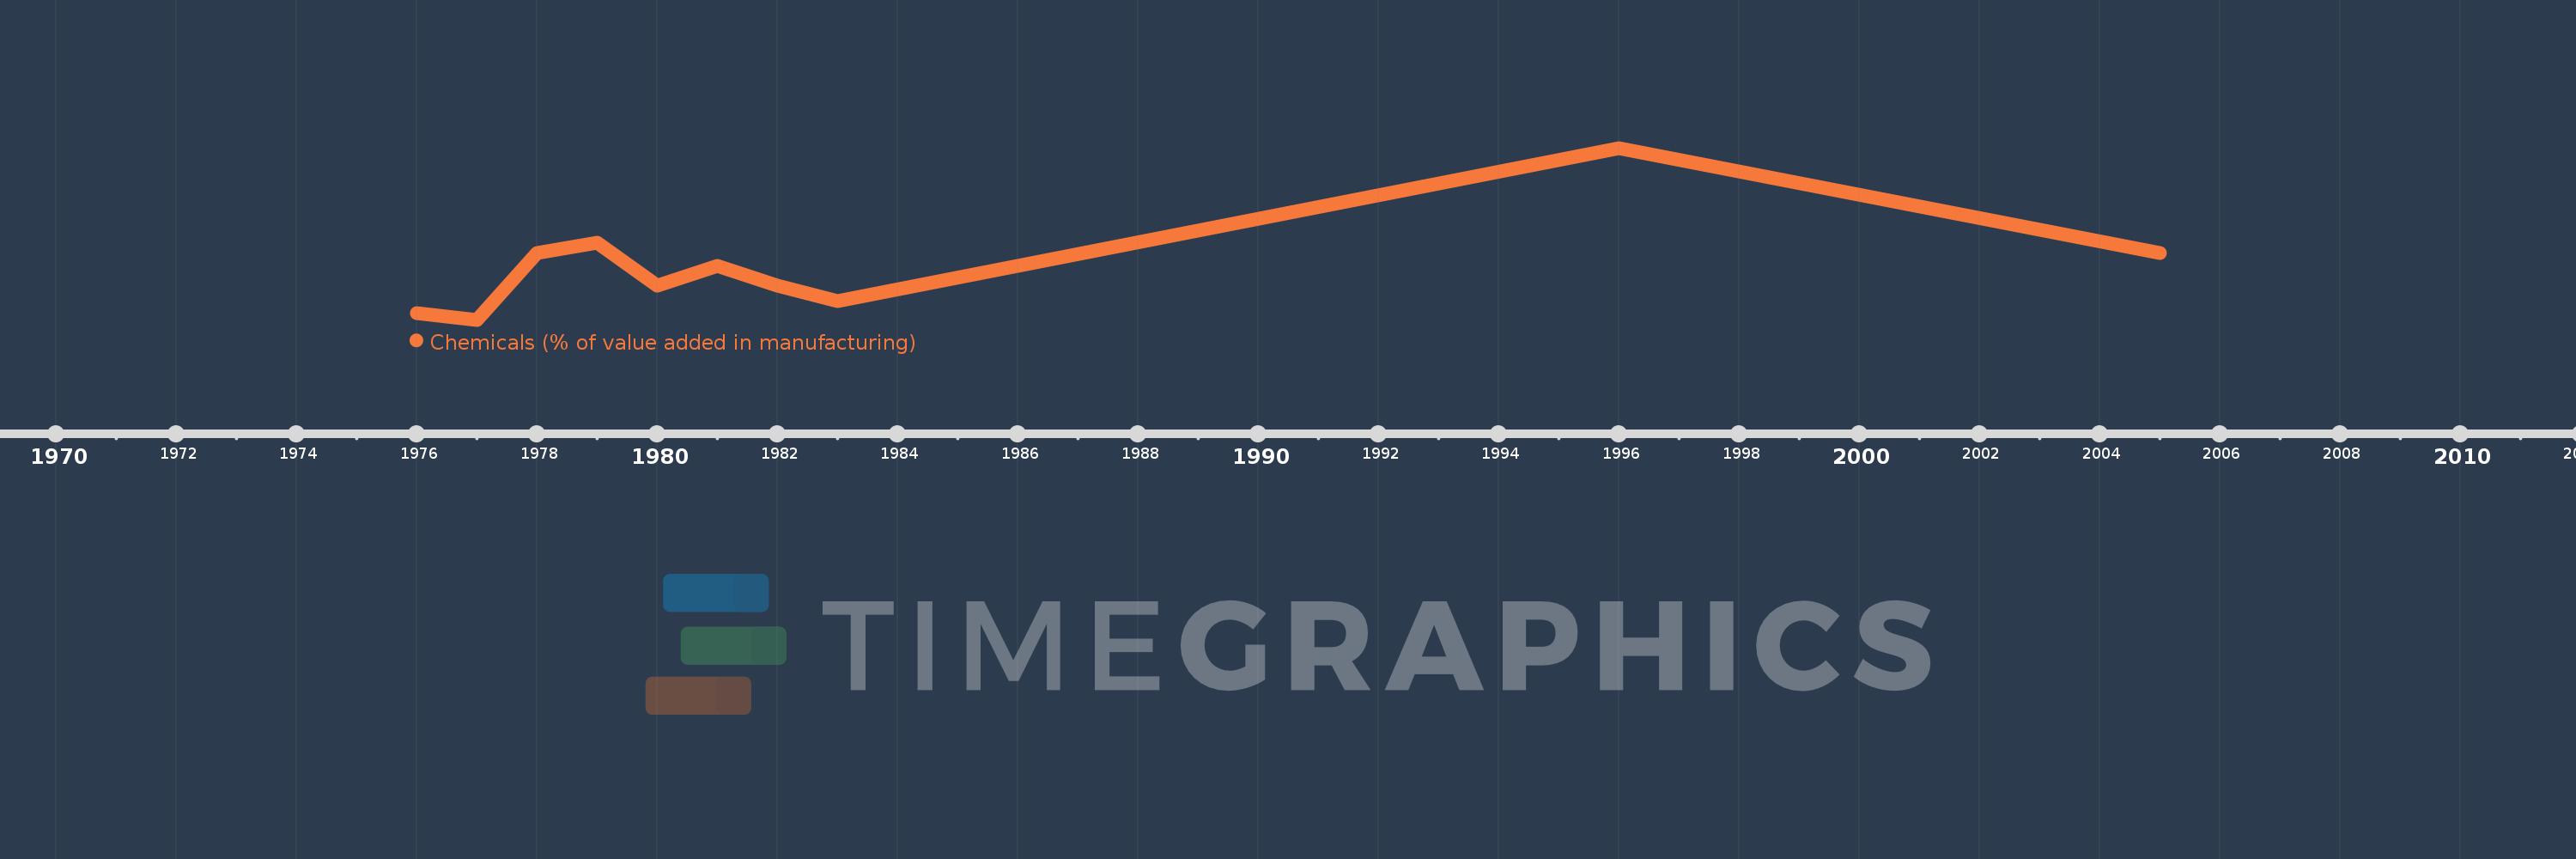
Questa scala temporale mostra un grafico dal 1976 anno al 2005 anno. Gambia, The. I dati fino ad 1975 anno non disponibili. Il numero di osservazioni attuali secondo i date: 10.
La fonte (nome):
Indicatori dello sviluppo mondiale
La fonte (organizzazione):
United Nations Industrial Development Organization, International Yearbook of Industrial Statistics.
Categorie:
Economy & Growth
sono stati aggiornati
23 apr 2017 anni
Indicatori delle variazioni dei valori per anni
In media:
3.232
Minima:
0.731
1 gen 1977 anni
Massimo:
8.842
1 gen 1996 anni
Alla data di osservazione
Valore
Variazione assoluta
La variazione rispetto al valore precedente
1 gen 1976 anni
1.061
+1.061
0.0%
1 gen 1977 anni
0.731
-0.329
-31.06%
1 gen 1978 anni
3.877
+3.145
430.04%
1 gen 1979 anni
4.375
+0.499
12.86%
1 gen 1980 anni
2.33
-2.046
-46.75%
1 gen 1981 anni
3.268
+0.938
40.29%
1 gen 1982 anni
2.343
-0.925
-28.3%
1 gen 1983 anni
1.593
-0.75
-32.01%
1 gen 1996 anni
8.842
+7.249
454.99%
1 gen 2005 anni
3.898
-4.944
-55.91%
Classificazione dei paesi secondo i statistiche attuali per anni
