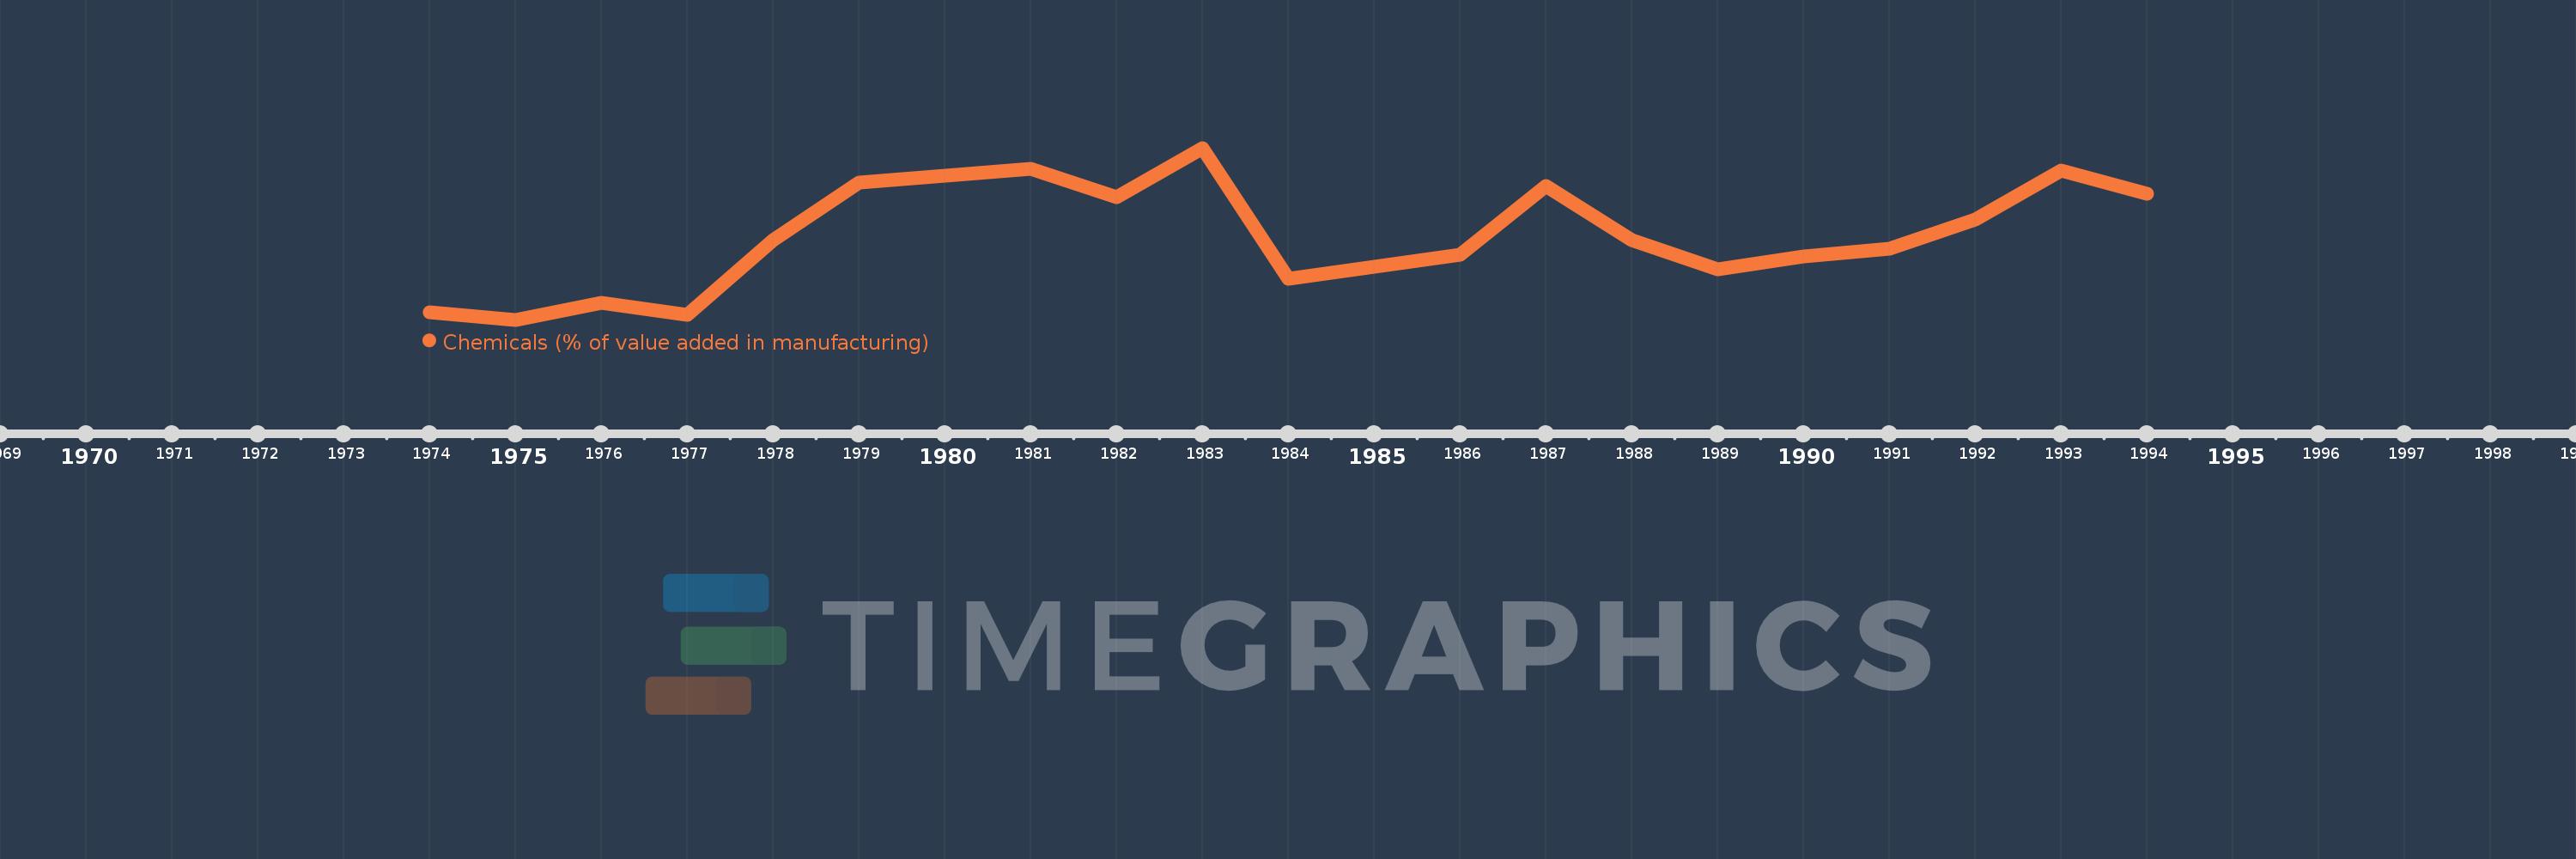
Questa scala temporale mostra un grafico dal 1974 anno al 1994 anno. Central African Republic. I dati fino ad 1973 anno non disponibili. Il numero di osservazioni attuali secondo i date: 19.
La fonte (nome):
Indicatori dello sviluppo mondiale
La fonte (organizzazione):
United Nations Industrial Development Organization, International Yearbook of Industrial Statistics.
Categorie:
Economy & Growth
sono stati aggiornati
23 apr 2017 anni
Indicatori delle variazioni dei valori per anni
In media:
6.969
Minima:
2.602
1 gen 1975 anni
Massimo:
11.675
1 gen 1983 anni
Alla data di osservazione
Valore
Variazione assoluta
La variazione rispetto al valore precedente
1 gen 1974 anni
3.002
+3.002
0.0%
1 gen 1975 anni
2.602
-0.4
-13.32%
1 gen 1976 anni
3.509
+0.907
34.87%
1 gen 1977 anni
2.863
-0.646
-18.4%
1 gen 1978 anni
6.812
+3.948
137.89%
1 gen 1979 anni
9.859
+3.048
44.74%
1 gen 1981 anni
10.566
+0.706
7.16%
1 gen 1982 anni
9.08
-1.485
-14.06%
1 gen 1983 anni
11.675
+2.595
28.57%
1 gen 1984 anni
4.769
-6.906
-59.15%
1 gen 1986 anni
6.028
+1.259
26.4%
1 gen 1987 anni
9.674
+3.646
60.49%
1 gen 1988 anni
6.794
-2.879
-29.76%
1 gen 1989 anni
5.265
-1.529
-22.51%
1 gen 1990 anni
5.932
+0.667
12.66%
1 gen 1991 anni
6.367
+0.436
7.34%
1 gen 1992 anni
7.877
+1.51
23.71%
1 gen 1993 anni
10.498
+2.621
33.27%
1 gen 1994 anni
9.246
-1.252
-11.93%
Classificazione dei paesi secondo i statistiche attuali per anni
