29
/it/
it
AIzaSyAYiBZKx7MnpbEhh9jyipgxe19OcubqV5w
April 1, 2024
112967
Costa Rica
CRI
true
2
1
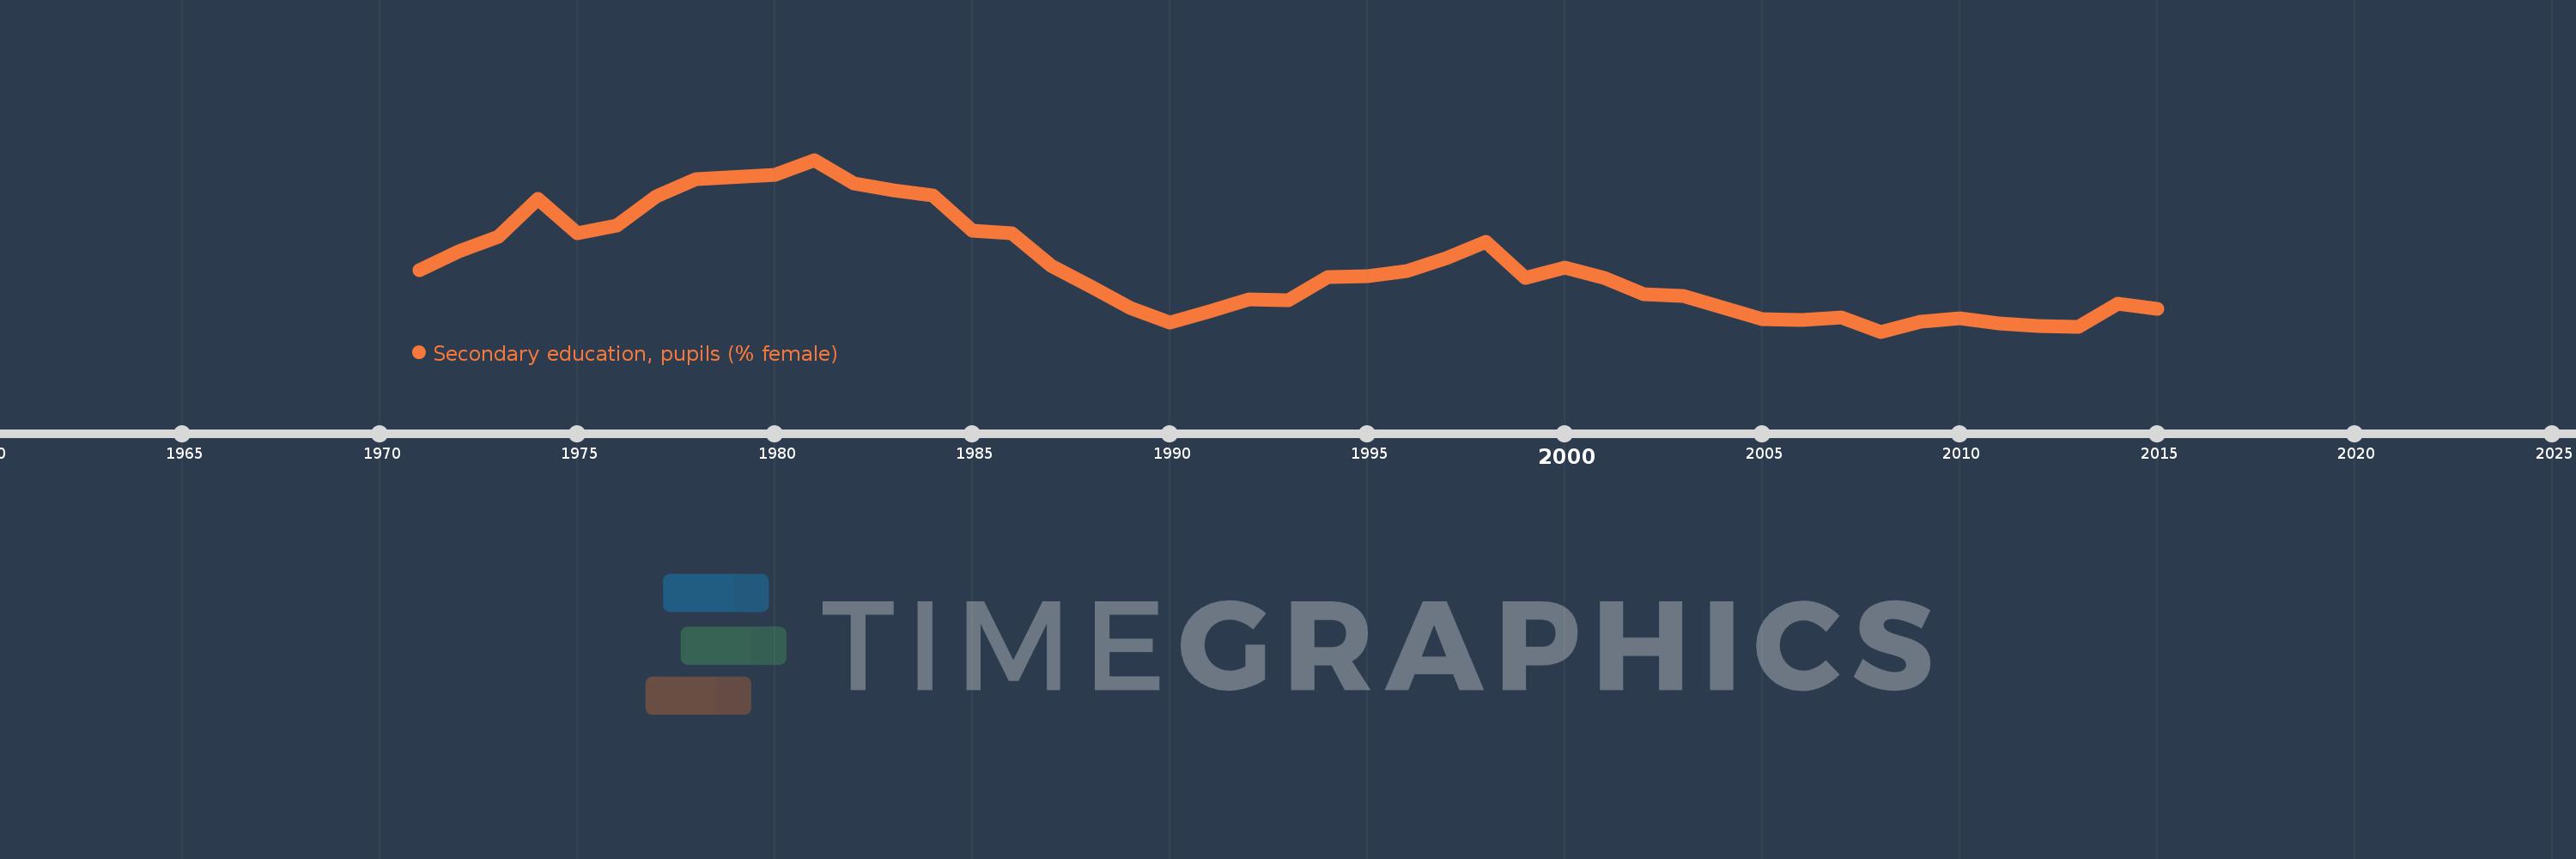
Secondary education, pupils (% female)
2015,2014,2013,2012,2011,2010,2009,2008,2007,2006,2005,2003,2002,2001,2000,1999,1998,1997,1996,1995,1994,1993,1992,1991,1990,1989,1988,1987,1986,1985,1984,1983,1982,1981,1980,1978,1977,1976,1975,1974,1973,1972,1971
Queste statistiche in altri paesi:
AfghanistanAlbaniaAlgeriaAndorraAngolaAntigua and BarbudaArab WorldArgentinaArmeniaArubaAustraliaAustriaAzerbaijanBahamas, TheBahrainBangladeshBarbadosBelarusBelgiumBelizeBeninBermudaBhutanBoliviaBosnia and HerzegovinaBotswanaBrazilBritish Virgin IslandsBrunei DarussalamBulgariaBurkina FasoBurundiCabo VerdeCambodiaCameroonCanadaCaribbean small statesCayman IslandsCentral African RepublicCentral Europe and the BalticsChadChileChinaColombiaComorosCongo, Dem. Rep.Congo, Rep.Costa RicaCote d'IvoireCroatiaCubaCuracaoCyprusCzech RepublicDenmarkDjiboutiDominicaDominican RepublicEarly-demographic dividendEast Asia & PacificEast Asia & Pacific (excluding high income)East Asia & Pacific (IDA & IBRD countries)EcuadorEgypt, Arab Rep.El SalvadorEquatorial GuineaEritreaEstoniaEthiopiaEuro areaEurope & Central AsiaEurope & Central Asia (excluding high income)Europe & Central Asia (IDA & IBRD countries)European UnionFijiFinlandFragile and conflict affected situationsFranceGabonGambia, TheGeorgiaGermanyGhanaGibraltarGreeceGrenadaGuatemalaGuineaGuinea-BissauGuyanaHeavily indebted poor countries (HIPC)High incomeHondurasHong Kong SAR, ChinaHungaryIBRD onlyIcelandIDA & IBRD totalIDA blendIDA onlyIDA totalIndiaIndonesiaIran, Islamic Rep.IraqIrelandIsraelItalyJamaicaJapanJordanKazakhstanKenyaKiribatiKorea, Dem. People’s Rep.Korea, Rep.KuwaitKyrgyz RepublicLao PDRLate-demographic dividendLatin America & Caribbean Latin America & Caribbean (excluding high income)Latin America & the Caribbean (IDA & IBRD countries)LatviaLeast developed countries: UN classificationLebanonLesothoLiberiaLibyaLiechtensteinLithuaniaLow & middle incomeLow incomeLower middle incomeLuxembourgMacao SAR, ChinaMacedonia, FYRMadagascarMalawiMalaysiaMaldivesMaliMaltaMarshall IslandsMauritaniaMauritiusMexicoMicronesia, Fed. Sts.Middle East & North AfricaMiddle East & North Africa (excluding high income)Middle East & North Africa (IDA & IBRD countries)Middle incomeMoldovaMonacoMongoliaMontenegroMoroccoMozambiqueMyanmarNamibiaNauruNepalNetherlandsNew ZealandNicaraguaNigerNigeriaNorth AmericaNorwayOECD membersOmanOther small statesPacific island small statesPakistanPalauPanamaPapua New GuineaParaguayPeruPhilippinesPolandPortugalPost-demographic dividendPre-demographic dividendPuerto RicoQatarRomaniaRussian FederationRwandaSamoaSan MarinoSao Tome and PrincipeSaudi ArabiaSenegalSerbiaSeychellesSierra LeoneSingaporeSint Maarten (Dutch part)Slovak RepublicSloveniaSmall statesSolomon IslandsSomaliaSouth AfricaSouth AsiaSouth Asia (IDA & IBRD)SpainSri LankaSt. Kitts and NevisSt. LuciaSt. Vincent and the GrenadinesSub-Saharan Africa Sub-Saharan Africa (excluding high income)Sub-Saharan Africa (IDA & IBRD countries)SudanSurinameSwazilandSwedenSwitzerlandSyrian Arab RepublicTajikistanTanzaniaThailandTimor-LesteTogoTongaTrinidad and TobagoTunisiaTurkeyTurkmenistanTurks and Caicos IslandsTuvaluUgandaUkraineUnited Arab EmiratesUnited KingdomUnited StatesUpper middle incomeUruguayUzbekistanVanuatuVenezuela, RBVietnamWest Bank and GazaWorldYemen, Rep.ZambiaZimbabwe Linea del tempo:
Questa scala temporale mostra un grafico dal 1971 anno al 2015 anno. Costa Rica. I dati fino ad 1970 anno non disponibili. Il numero di osservazioni attuali secondo i date: 43.
La fonte (nome):
Indicatori dello sviluppo mondiale
La fonte (organizzazione):
United Nations Educational, Scientific, and Cultural Organization (UNESCO) Institute for Statistics.
Categorie:
Education, Gender
sono stati aggiornati
23 apr 2017 anni
Indicatori delle variazioni dei valori per anni
Minima:
49.804
1 gen 2008 anni
Massimo:
53.018
1 gen 1981 anni
Alla data di osservazione
Valore
Variazione assoluta
La variazione rispetto al valore precedente
1 gen 1971 anni
50.958
+50.958
0.0%
1 gen 1972 anni
51.309
+0.351
0.69%
1 gen 1973 anni
51.584
+0.275
0.54%
1 gen 1974 anni
52.286
+0.702
1.36%
1 gen 1975 anni
51.648
-0.638
-1.22%
1 gen 1976 anni
51.788
+0.14
0.27%
1 gen 1977 anni
52.332
+0.545
1.05%
1 gen 1978 anni
52.651
+0.319
0.61%
1 gen 1980 anni
52.737
+0.086
0.16%
1 gen 1981 anni
53.018
+0.281
0.53%
1 gen 1982 anni
52.577
-0.441
-0.83%
1 gen 1983 anni
52.441
-0.136
-0.26%
1 gen 1984 anni
52.353
-0.088
-0.17%
1 gen 1985 anni
51.691
-0.662
-1.26%
1 gen 1986 anni
51.644
-0.046
-0.09%
1 gen 1987 anni
51.033
-0.611
-1.18%
1 gen 1988 anni
50.646
-0.387
-0.76%
1 gen 1989 anni
50.25
-0.396
-0.78%
1 gen 1990 anni
49.973
-0.276
-0.55%
1 gen 1991 anni
50.177
+0.204
0.41%
1 gen 1992 anni
50.401
+0.224
0.45%
1 gen 1993 anni
50.398
-0.003
-0.01%
1 gen 1994 anni
50.826
+0.428
0.85%
1 gen 1995 anni
50.84
+0.015
0.03%
1 gen 1996 anni
50.942
+0.102
0.2%
1 gen 1997 anni
51.179
+0.237
0.47%
1 gen 1998 anni
51.481
+0.301
0.59%
1 gen 1999 anni
50.816
-0.665
-1.29%
1 gen 2000 anni
51.004
+0.189
0.37%
1 gen 2001 anni
50.809
-0.195
-0.38%
1 gen 2002 anni
50.5
-0.308
-0.61%
1 gen 2003 anni
50.464
-0.036
-0.07%
1 gen 2005 anni
50.036
-0.428
-0.85%
1 gen 2006 anni
50.027
-0.009
-0.02%
1 gen 2007 anni
50.072
+0.045
0.09%
1 gen 2008 anni
49.804
-0.267
-0.53%
1 gen 2009 anni
49.986
+0.182
0.36%
1 gen 2010 anni
50.054
+0.068
0.14%
1 gen 2011 anni
49.952
-0.102
-0.2%
1 gen 2012 anni
49.911
-0.041
-0.08%
1 gen 2013 anni
49.886
-0.025
-0.05%
1 gen 2014 anni
50.332
+0.445
0.89%
1 gen 2015 anni
50.225
-0.106
-0.21%
Classificazione dei paesi secondo i statistiche attuali per anni


Commenti: