29
/it/
it
AIzaSyAYiBZKx7MnpbEhh9jyipgxe19OcubqV5w
April 1, 2024
101567
Canada
CAN
true
2
1
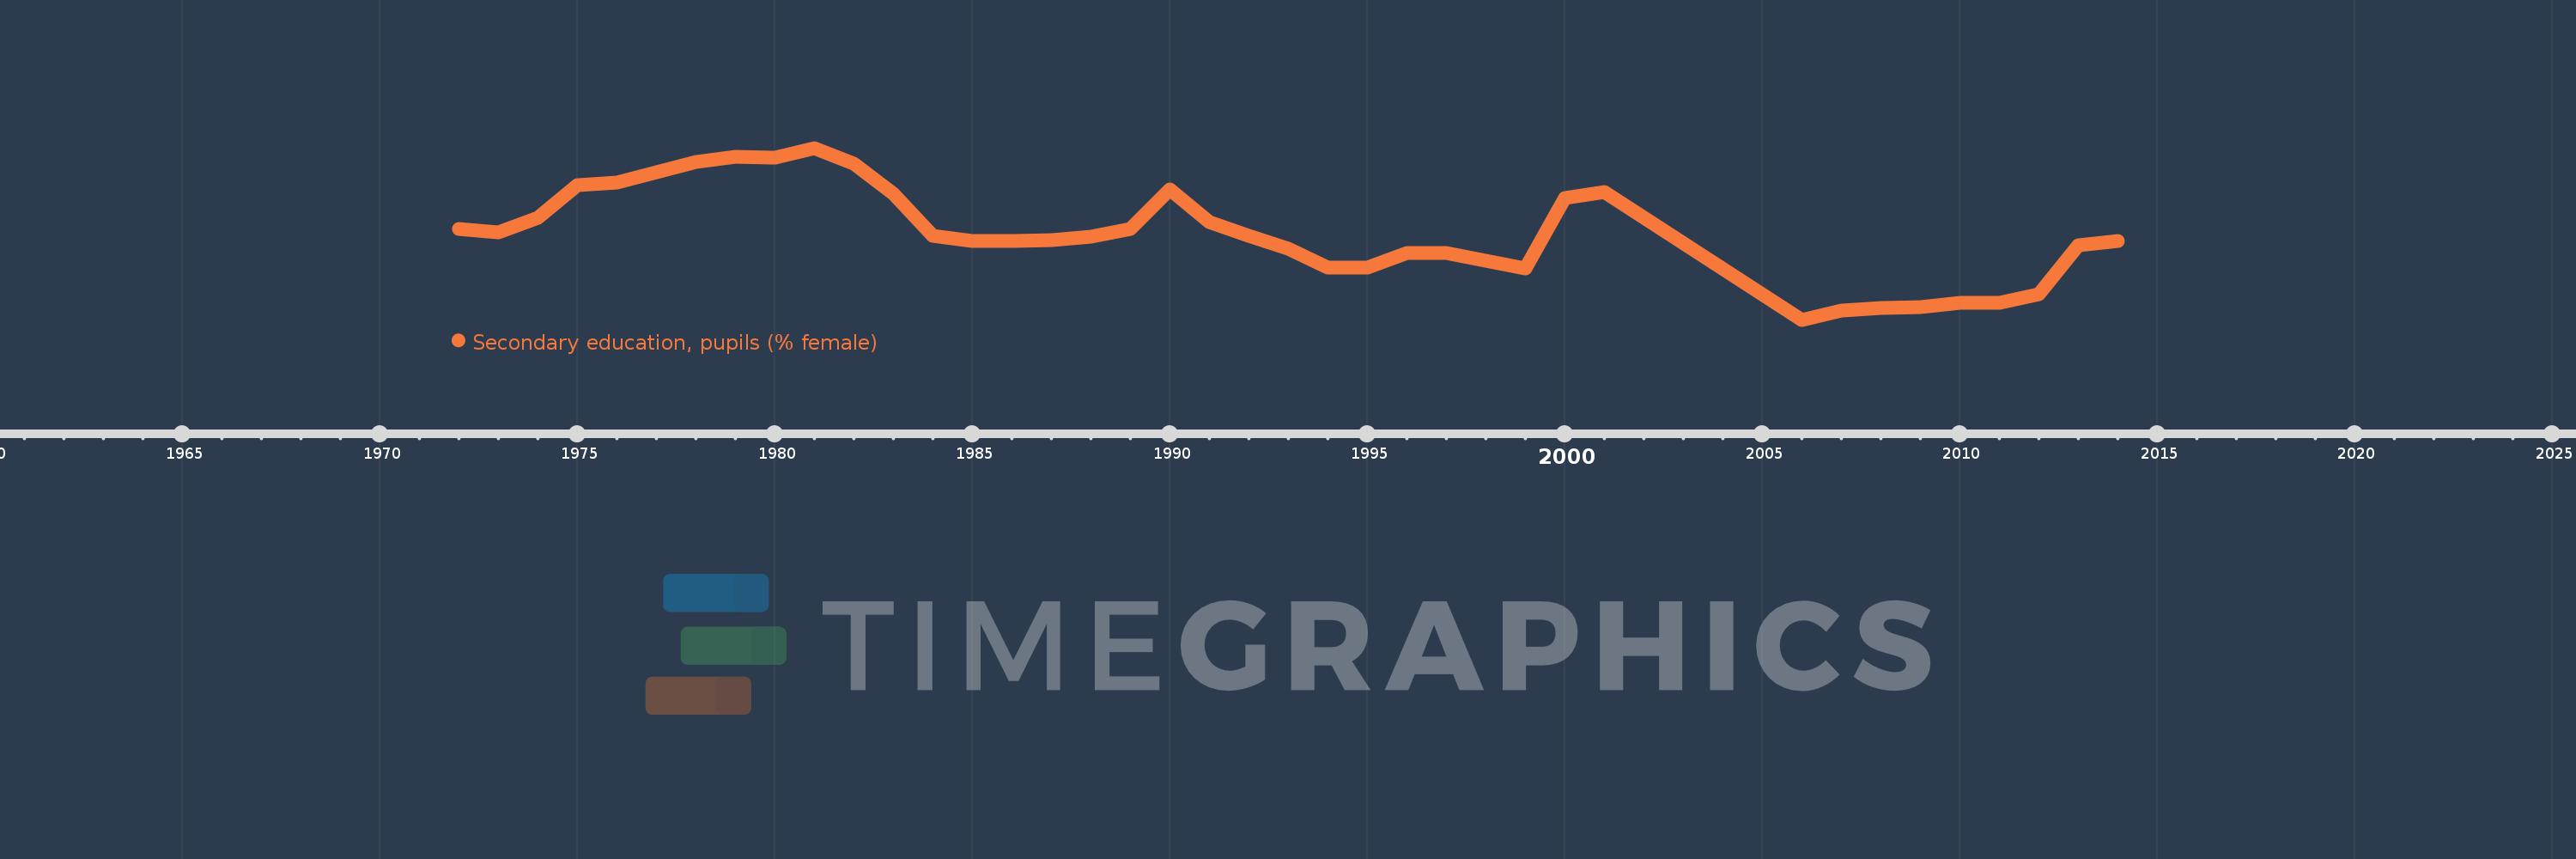
Secondary education, pupils (% female)
2014,2013,2012,2011,2010,2009,2008,2007,2006,2001,2000,1999,1997,1996,1995,1994,1993,1992,1991,1990,1989,1988,1987,1986,1985,1984,1983,1982,1981,1980,1979,1978,1977,1976,1975,1974,1973,1972
Queste statistiche in altri paesi:
AfghanistanAlbaniaAlgeriaAndorraAngolaAntigua and BarbudaArab WorldArgentinaArmeniaArubaAustraliaAustriaAzerbaijanBahamas, TheBahrainBangladeshBarbadosBelarusBelgiumBelizeBeninBermudaBhutanBoliviaBosnia and HerzegovinaBotswanaBrazilBritish Virgin IslandsBrunei DarussalamBulgariaBurkina FasoBurundiCabo VerdeCambodiaCameroonCanadaCaribbean small statesCayman IslandsCentral African RepublicCentral Europe and the BalticsChadChileChinaColombiaComorosCongo, Dem. Rep.Congo, Rep.Costa RicaCote d'IvoireCroatiaCubaCuracaoCyprusCzech RepublicDenmarkDjiboutiDominicaDominican RepublicEarly-demographic dividendEast Asia & PacificEast Asia & Pacific (excluding high income)East Asia & Pacific (IDA & IBRD countries)EcuadorEgypt, Arab Rep.El SalvadorEquatorial GuineaEritreaEstoniaEthiopiaEuro areaEurope & Central AsiaEurope & Central Asia (excluding high income)Europe & Central Asia (IDA & IBRD countries)European UnionFijiFinlandFragile and conflict affected situationsFranceGabonGambia, TheGeorgiaGermanyGhanaGibraltarGreeceGrenadaGuatemalaGuineaGuinea-BissauGuyanaHeavily indebted poor countries (HIPC)High incomeHondurasHong Kong SAR, ChinaHungaryIBRD onlyIcelandIDA & IBRD totalIDA blendIDA onlyIDA totalIndiaIndonesiaIran, Islamic Rep.IraqIrelandIsraelItalyJamaicaJapanJordanKazakhstanKenyaKiribatiKorea, Dem. People’s Rep.Korea, Rep.KuwaitKyrgyz RepublicLao PDRLate-demographic dividendLatin America & Caribbean Latin America & Caribbean (excluding high income)Latin America & the Caribbean (IDA & IBRD countries)LatviaLeast developed countries: UN classificationLebanonLesothoLiberiaLibyaLiechtensteinLithuaniaLow & middle incomeLow incomeLower middle incomeLuxembourgMacao SAR, ChinaMacedonia, FYRMadagascarMalawiMalaysiaMaldivesMaliMaltaMarshall IslandsMauritaniaMauritiusMexicoMicronesia, Fed. Sts.Middle East & North AfricaMiddle East & North Africa (excluding high income)Middle East & North Africa (IDA & IBRD countries)Middle incomeMoldovaMonacoMongoliaMontenegroMoroccoMozambiqueMyanmarNamibiaNauruNepalNetherlandsNew ZealandNicaraguaNigerNigeriaNorth AmericaNorwayOECD membersOmanOther small statesPacific island small statesPakistanPalauPanamaPapua New GuineaParaguayPeruPhilippinesPolandPortugalPost-demographic dividendPre-demographic dividendPuerto RicoQatarRomaniaRussian FederationRwandaSamoaSan MarinoSao Tome and PrincipeSaudi ArabiaSenegalSerbiaSeychellesSierra LeoneSingaporeSint Maarten (Dutch part)Slovak RepublicSloveniaSmall statesSolomon IslandsSomaliaSouth AfricaSouth AsiaSouth Asia (IDA & IBRD)SpainSri LankaSt. Kitts and NevisSt. LuciaSt. Vincent and the GrenadinesSub-Saharan Africa Sub-Saharan Africa (excluding high income)Sub-Saharan Africa (IDA & IBRD countries)SudanSurinameSwazilandSwedenSwitzerlandSyrian Arab RepublicTajikistanTanzaniaThailandTimor-LesteTogoTongaTrinidad and TobagoTunisiaTurkeyTurkmenistanTurks and Caicos IslandsTuvaluUgandaUkraineUnited Arab EmiratesUnited KingdomUnited StatesUpper middle incomeUruguayUzbekistanVanuatuVenezuela, RBVietnamWest Bank and GazaWorldYemen, Rep.ZambiaZimbabwe Linea del tempo:
Questa scala temporale mostra un grafico dal 1972 anno al 2014 anno. Canada. I dati fino ad 1971 anno non disponibili. Il numero di osservazioni attuali secondo i date: 38.
La fonte (nome):
Indicatori dello sviluppo mondiale
La fonte (organizzazione):
United Nations Educational, Scientific, and Cultural Organization (UNESCO) Institute for Statistics.
Categorie:
Education, Gender
sono stati aggiornati
23 apr 2017 anni
Indicatori delle variazioni dei valori per anni
Minima:
48.092
1 gen 2006 anni
Massimo:
49.485
1 gen 1981 anni
Alla data di osservazione
Valore
Variazione assoluta
La variazione rispetto al valore precedente
1 gen 1972 anni
48.829
+48.829
0.0%
1 gen 1973 anni
48.802
-0.027
-0.05%
1 gen 1974 anni
48.922
+0.12
0.25%
1 gen 1975 anni
49.18
+0.259
0.53%
1 gen 1976 anni
49.205
+0.025
0.05%
1 gen 1977 anni
49.29
+0.085
0.17%
1 gen 1978 anni
49.37
+0.08
0.16%
1 gen 1979 anni
49.415
+0.045
0.09%
1 gen 1980 anni
49.408
-0.007
-0.01%
1 gen 1981 anni
49.485
+0.077
0.16%
1 gen 1982 anni
49.359
-0.126
-0.26%
1 gen 1983 anni
49.112
-0.247
-0.5%
1 gen 1984 anni
48.771
-0.34
-0.69%
1 gen 1985 anni
48.73
-0.041
-0.08%
1 gen 1986 anni
48.732
+0.002
0.0%
1 gen 1987 anni
48.735
+0.003
0.01%
1 gen 1988 anni
48.767
+0.032
0.07%
1 gen 1989 anni
48.828
+0.061
0.13%
1 gen 1990 anni
49.149
+0.32
0.66%
1 gen 1991 anni
48.886
-0.263
-0.54%
1 gen 1992 anni
48.773
-0.113
-0.23%
1 gen 1993 anni
48.671
-0.101
-0.21%
1 gen 1994 anni
48.517
-0.154
-0.32%
1 gen 1995 anni
48.518
+0.0
0.0%
1 gen 1996 anni
48.631
+0.113
0.23%
1 gen 1997 anni
48.631
0.0
0.0%
1 gen 1999 anni
48.506
-0.126
-0.26%
1 gen 2000 anni
49.078
+0.572
1.18%
1 gen 2001 anni
49.128
+0.05
0.1%
1 gen 2006 anni
48.092
-1.035
-2.11%
1 gen 2007 anni
48.169
+0.077
0.16%
1 gen 2008 anni
48.189
+0.02
0.04%
1 gen 2009 anni
48.197
+0.007
0.02%
1 gen 2010 anni
48.226
+0.029
0.06%
1 gen 2011 anni
48.227
+0.001
0.0%
1 gen 2012 anni
48.3
+0.073
0.15%
1 gen 2013 anni
48.693
+0.392
0.81%
1 gen 2014 anni
48.733
+0.04
0.08%
Classificazione dei paesi secondo i statistiche attuali per anni


Commenti: