29
/it/
it
AIzaSyAYiBZKx7MnpbEhh9jyipgxe19OcubqV5w
April 1, 2024
108834
Comoros
COM
true
2
1
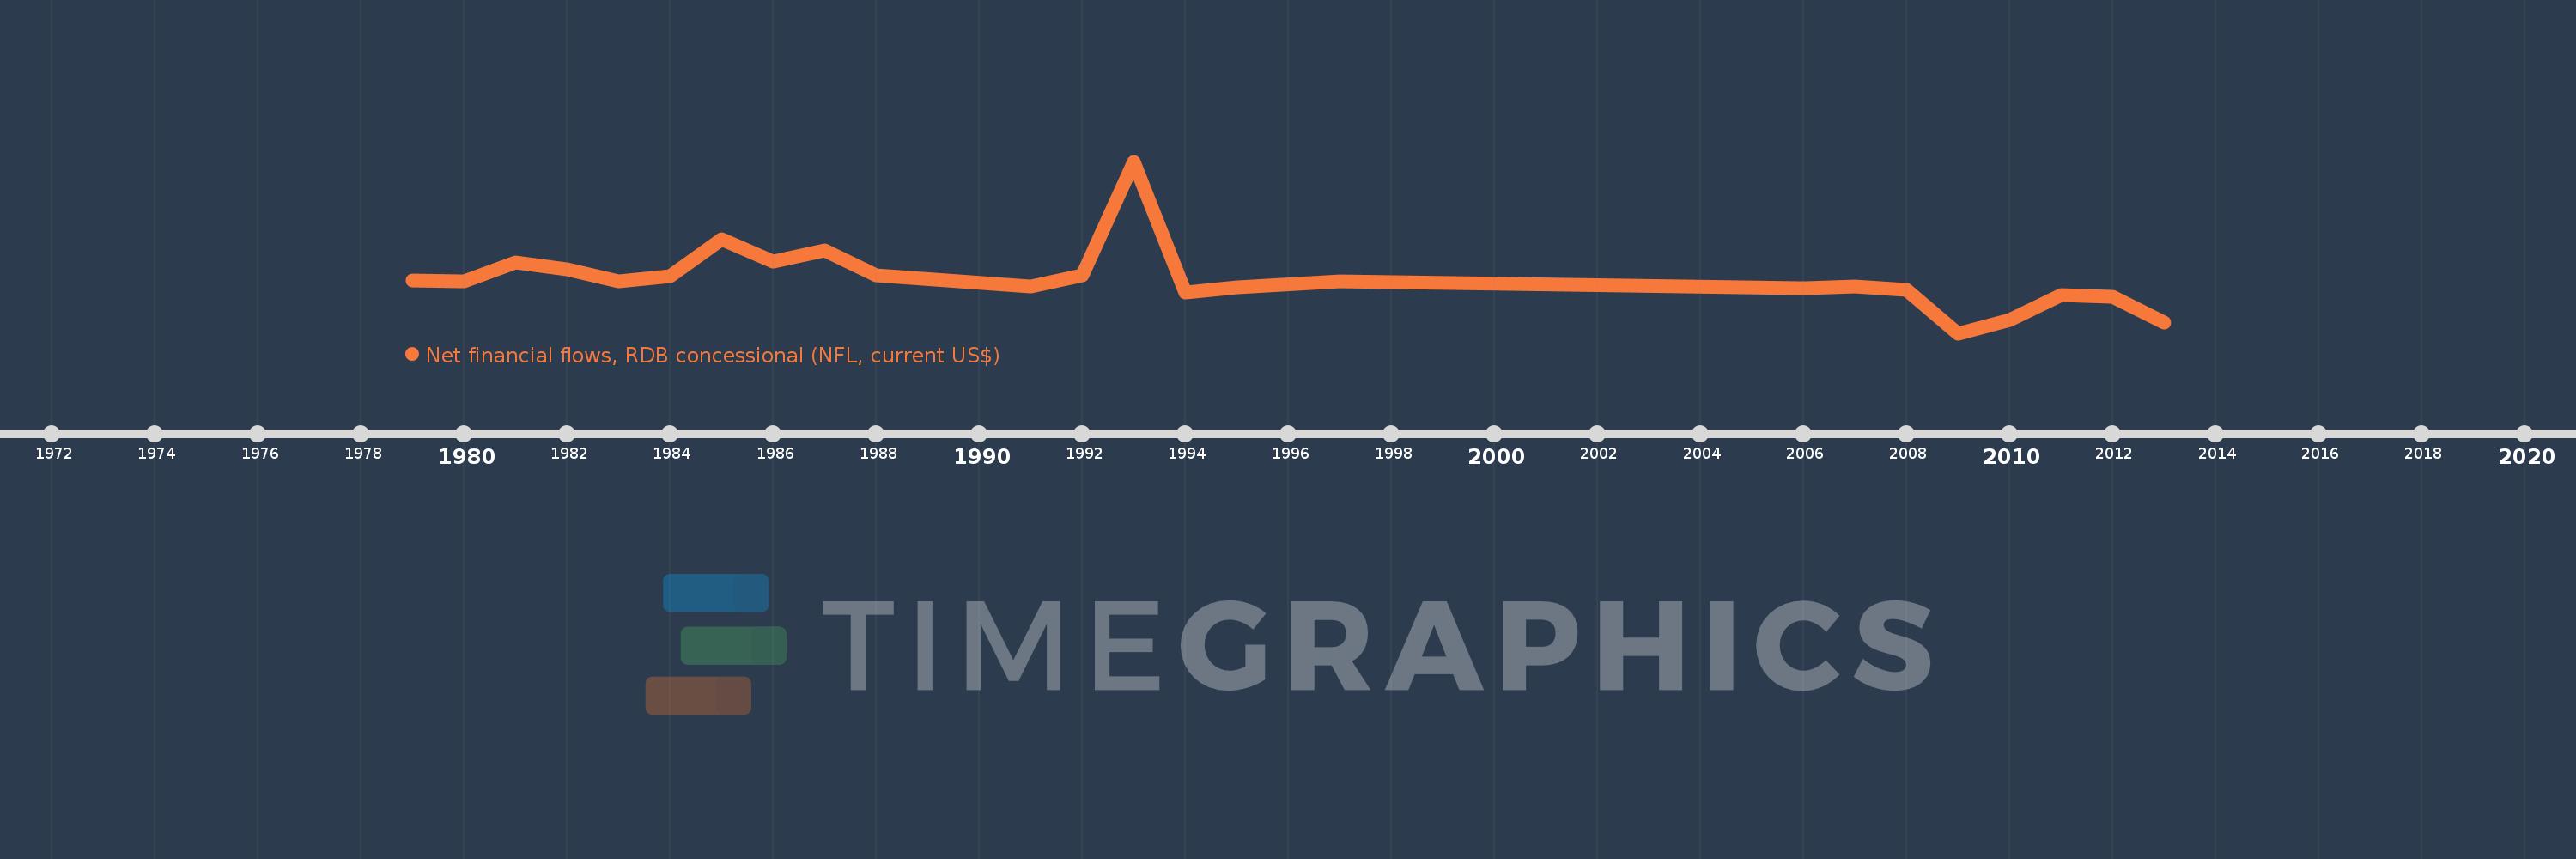
Net financial flows, RDB concessional (NFL, current US$)
2013,2012,2011,2010,2009,2008,2007,2006,1997,1995,1994,1993,1992,1991,1988,1987,1986,1985,1984,1983,1982,1981,1980,1979
Queste statistiche in altri paesi:
Linea del tempo:
Questa scala temporale mostra un grafico dal 1979 anno al 2013 anno. Comoros. I dati fino ad 1978 anno non disponibili. Il numero di osservazioni attuali secondo i date: 24.
La fonte (nome):
Indicatori dello sviluppo mondiale
La fonte (organizzazione):
World Bank, International Debt Statistics.
Categorie:
External Debt
sono stati aggiornati
23 apr 2017 anni
Indicatori delle variazioni dei valori per anni
Minima:
-5.398 Mln
1 gen 2009 anni
Massimo:
14.258 Mln
1 gen 1993 anni
Alla data di osservazione
Valore
Variazione assoluta
La variazione rispetto al valore precedente
1 gen 1979 anni
644.0 Mille.
+644.0 Mille.
0.0%
1 gen 1980 anni
502.0 Mille.
-142.0 Mille.
-22.05%
1 gen 1981 anni
2.716 Mln
+2.214 Mln
441.04%
1 gen 1982 anni
1.972 Mln
-744.0 Mille.
-27.39%
1 gen 1983 anni
579.0 Mille.
-1.393 Mln
-70.64%
1 gen 1984 anni
1.141 Mln
+562.0 Mille.
97.06%
1 gen 1985 anni
5.342 Mln
+4.201 Mln
368.19%
1 gen 1986 anni
2.793 Mln
-2.549 Mln
-47.72%
1 gen 1987 anni
4.076 Mln
+1.283 Mln
45.94%
1 gen 1988 anni
1.214 Mln
-2.862 Mln
-70.22%
1 gen 1991 anni
-28.0 Mille.
-1.242 Mln
-102.31%
1 gen 1992 anni
1.196 Mln
+1.224 Mln
-4.37 Mille.%
1 gen 1993 anni
14.258 Mln
+13.062 Mln
1.09 Mille.%
1 gen 1994 anni
-766.0 Mille.
-15.024 Mln
-105.37%
1 gen 1995 anni
-145.0 Mille.
+621.0 Mille.
-81.07%
1 gen 1997 anni
595.0 Mille.
+740.0 Mille.
-510.34%
1 gen 2006 anni
-233.0 Mille.
-828.0 Mille.
-139.16%
1 gen 2007 anni
-64.0 Mille.
+169.0 Mille.
-72.53%
1 gen 2008 anni
-420.0 Mille.
-356.0 Mille.
556.25%
1 gen 2009 anni
-5.398 Mln
-4.978 Mln
1.19 Mille.%
1 gen 2010 anni
-3.917 Mln
+1.481 Mln
-27.44%
1 gen 2011 anni
-1.07 Mln
+2.847 Mln
-72.68%
1 gen 2012 anni
-1.182 Mln
-112.0 Mille.
10.47%
1 gen 2013 anni
-4.143 Mln
-2.961 Mln
250.51%
Classificazione dei paesi secondo i statistiche attuali per anni


Commenti: