29
/
en
AIzaSyAYiBZKx7MnpbEhh9jyipgxe19OcubqV5w
April 1, 2024
108834
Comoros
COM
true
2
1
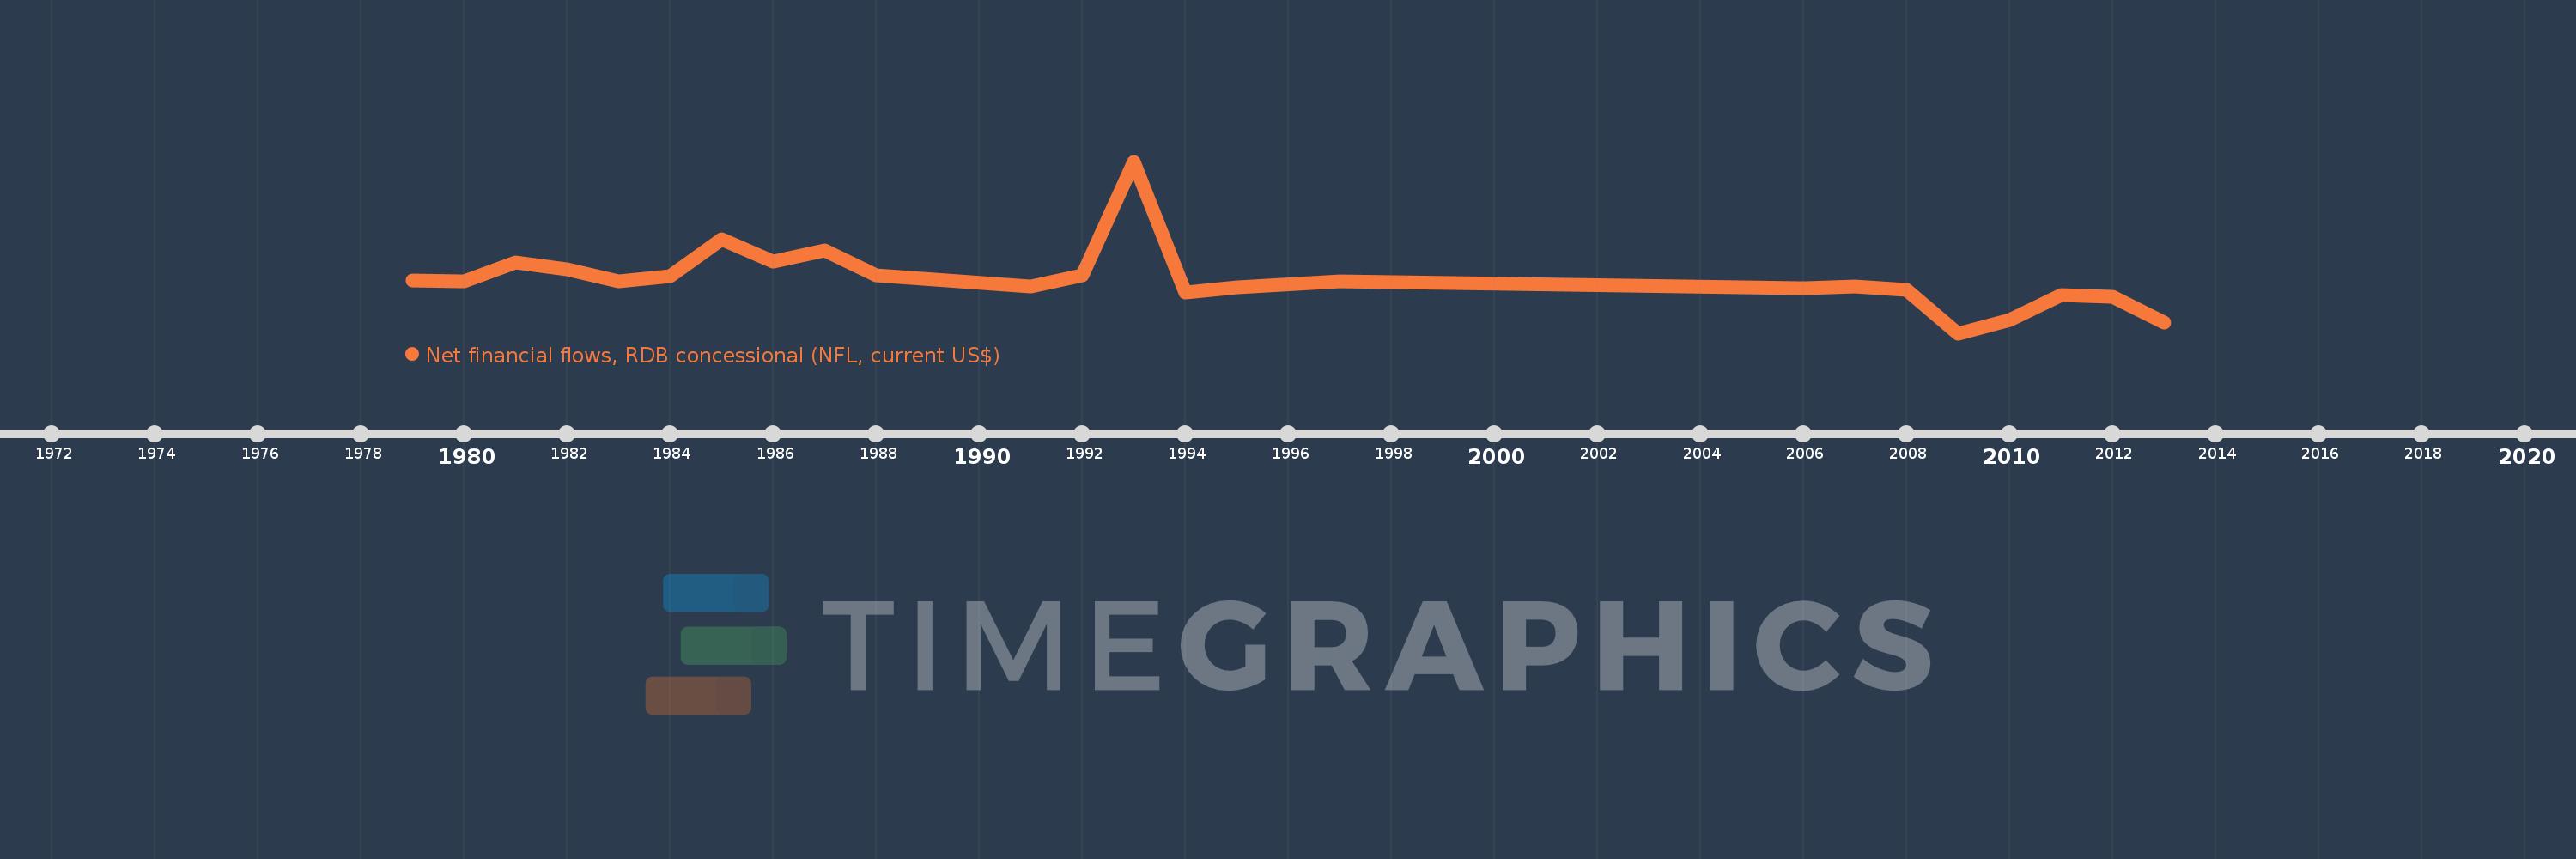
Net financial flows, RDB concessional (NFL, current US$)
2013,2012,2011,2010,2009,2008,2007,2006,1997,1995,1994,1993,1992,1991,1988,1987,1986,1985,1984,1983,1982,1981,1980,1979
This statistics in other country:
Timeline:
This timeline shows a graph from 1979 to 2013 of Comoros. No data until 1978. Number of actual observations by date: 24.
Source name:
World Development Indicators
Source organization:
World Bank, International Debt Statistics.
Categories, topics:
External Debt
Last updated:
apr 23, 2017
Indicators value changes by year
Minimum:
-5.398 mln
jan 1, 2009
Maximum:
14.258 mln
jan 1, 1993
At the date of observation
Value
Absolute change
Change from previous value
jan 1, 1979
644.0K
+644.0K
0.0%
jan 1, 1980
502.0K
-142.0K
-22.05%
jan 1, 1981
2.716 mln
+2.214 mln
441.04%
jan 1, 1982
1.972 mln
-744.0K
-27.39%
jan 1, 1983
579.0K
-1.393 mln
-70.64%
jan 1, 1984
1.141 mln
+562.0K
97.06%
jan 1, 1985
5.342 mln
+4.201 mln
368.19%
jan 1, 1986
2.793 mln
-2.549 mln
-47.72%
jan 1, 1987
4.076 mln
+1.283 mln
45.94%
jan 1, 1988
1.214 mln
-2.862 mln
-70.22%
jan 1, 1991
-28.0K
-1.242 mln
-102.31%
jan 1, 1992
1.196 mln
+1.224 mln
-4.37K%
jan 1, 1993
14.258 mln
+13.062 mln
1.09K%
jan 1, 1994
-766.0K
-15.024 mln
-105.37%
jan 1, 1995
-145.0K
+621.0K
-81.07%
jan 1, 1997
595.0K
+740.0K
-510.34%
jan 1, 2006
-233.0K
-828.0K
-139.16%
jan 1, 2007
-64.0K
+169.0K
-72.53%
jan 1, 2008
-420.0K
-356.0K
556.25%
jan 1, 2009
-5.398 mln
-4.978 mln
1.19K%
jan 1, 2010
-3.917 mln
+1.481 mln
-27.44%
jan 1, 2011
-1.07 mln
+2.847 mln
-72.68%
jan 1, 2012
-1.182 mln
-112.0K
10.47%
jan 1, 2013
-4.143 mln
-2.961 mln
250.51%
Ranking of countries by current statistics by years


Comments: