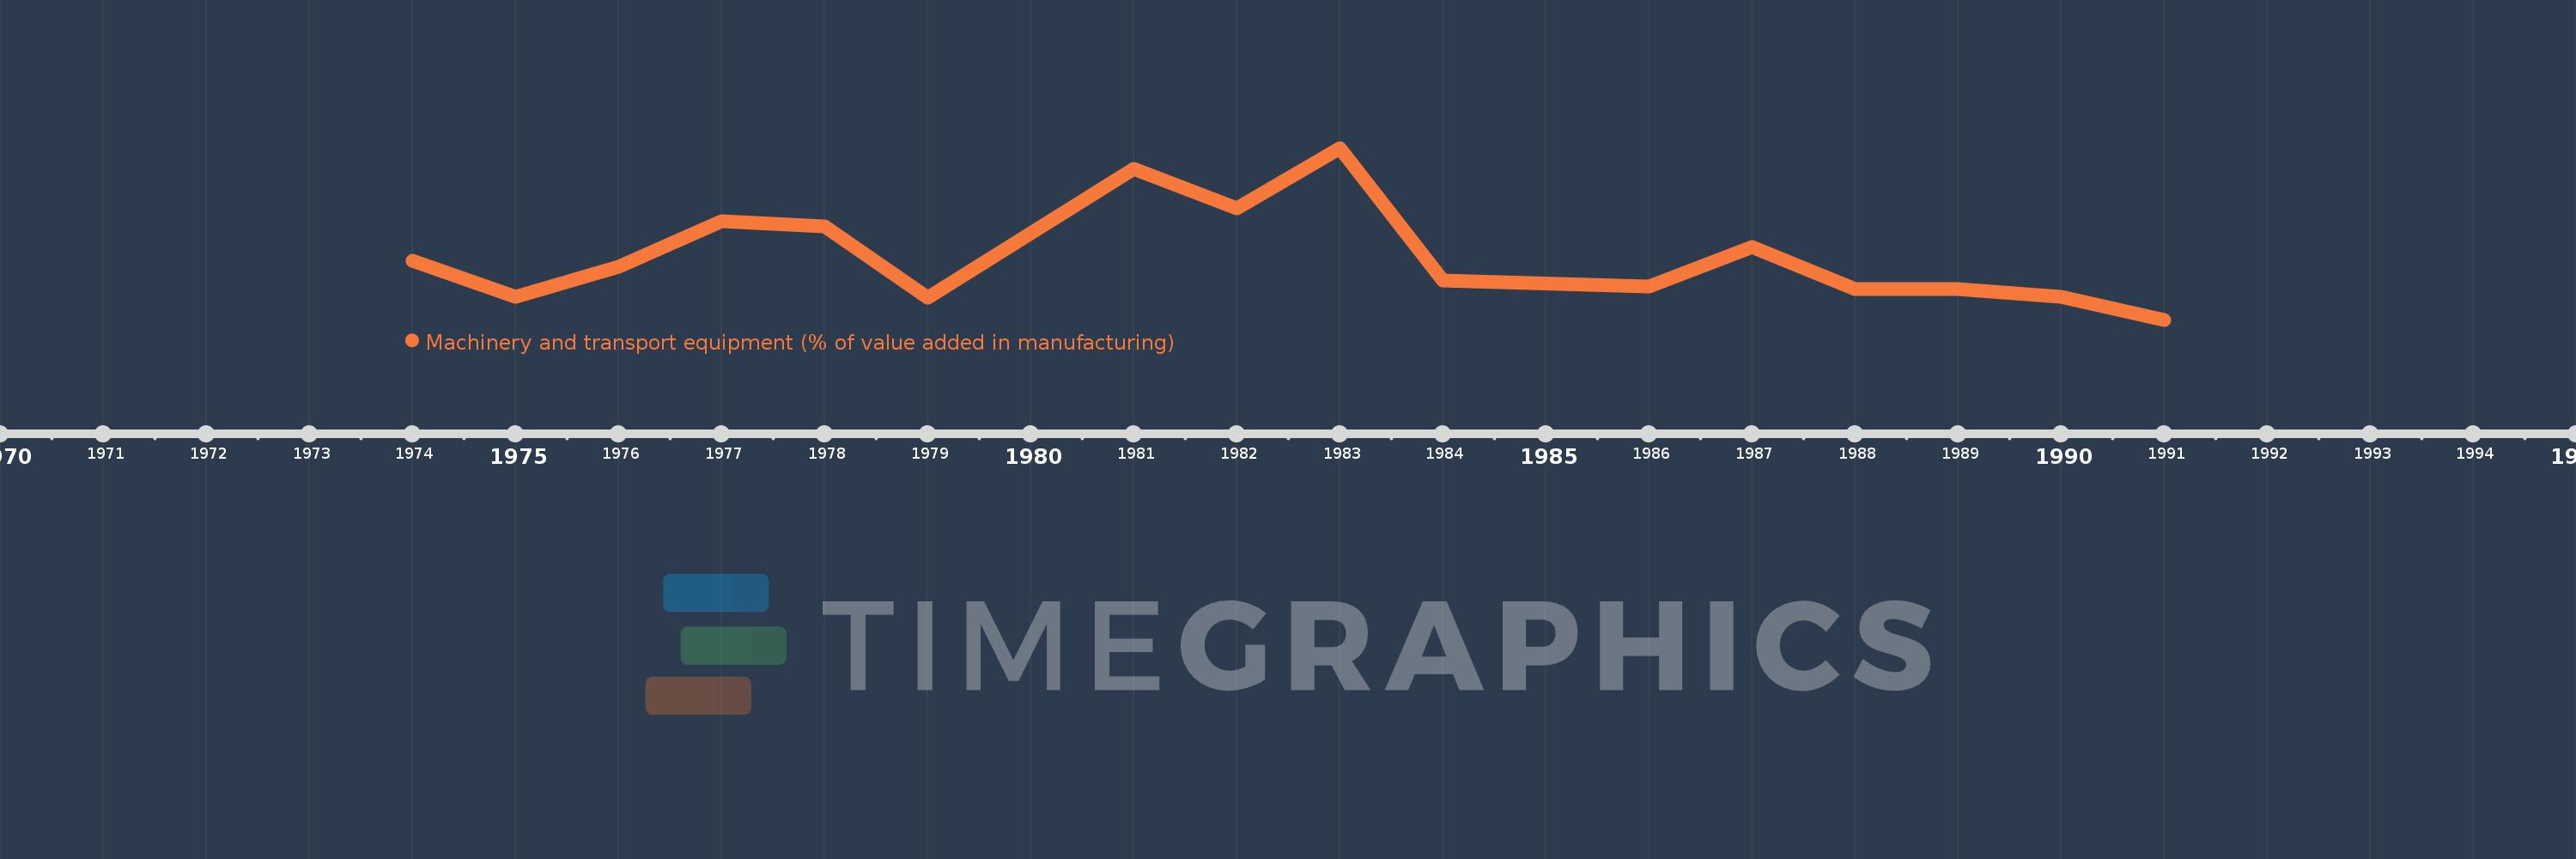
Questa scala temporale mostra un grafico dal 1974 anno al 1991 anno. Central African Republic. I dati fino ad 1973 anno non disponibili. Il numero di osservazioni attuali secondo i date: 16.
La fonte (nome):
Indicatori dello sviluppo mondiale
La fonte (organizzazione):
United Nations Industrial Development Organization, International Yearbook of Industrial Statistics.
Categorie:
Economy & Growth
sono stati aggiornati
23 apr 2017 anni
Indicatori delle variazioni dei valori per anni
In media:
4.363
Minima:
1.911
1 gen 1991 anni
Massimo:
8.571
1 gen 1983 anni
Alla data di osservazione
Valore
Variazione assoluta
La variazione rispetto al valore precedente
1 gen 1974 anni
4.185
+4.185
0.0%
1 gen 1975 anni
2.798
-1.387
-33.14%
1 gen 1976 anni
3.976
+1.177
42.08%
1 gen 1977 anni
5.746
+1.771
44.54%
1 gen 1978 anni
5.535
-0.212
-3.69%
1 gen 1979 anni
2.753
-2.782
-50.26%
1 gen 1981 anni
7.747
+4.994
181.42%
1 gen 1982 anni
6.221
-1.526
-19.7%
1 gen 1983 anni
8.571
+2.35
37.78%
1 gen 1984 anni
3.418
-5.153
-60.12%
1 gen 1986 anni
3.202
-0.216
-6.32%
1 gen 1987 anni
4.734
+1.532
47.86%
1 gen 1988 anni
3.111
-1.623
-34.28%
1 gen 1989 anni
3.1
-0.011
-0.36%
1 gen 1990 anni
2.805
-0.295
-9.52%
1 gen 1991 anni
1.911
-0.894
-31.87%
Classificazione dei paesi secondo i statistiche attuali per anni
