30
/it/
AIzaSyAYiBZKx7MnpbEhh9jyipgxe19OcubqV5w
April 1, 2024
100172
Cameroon
CMR
true
2
1
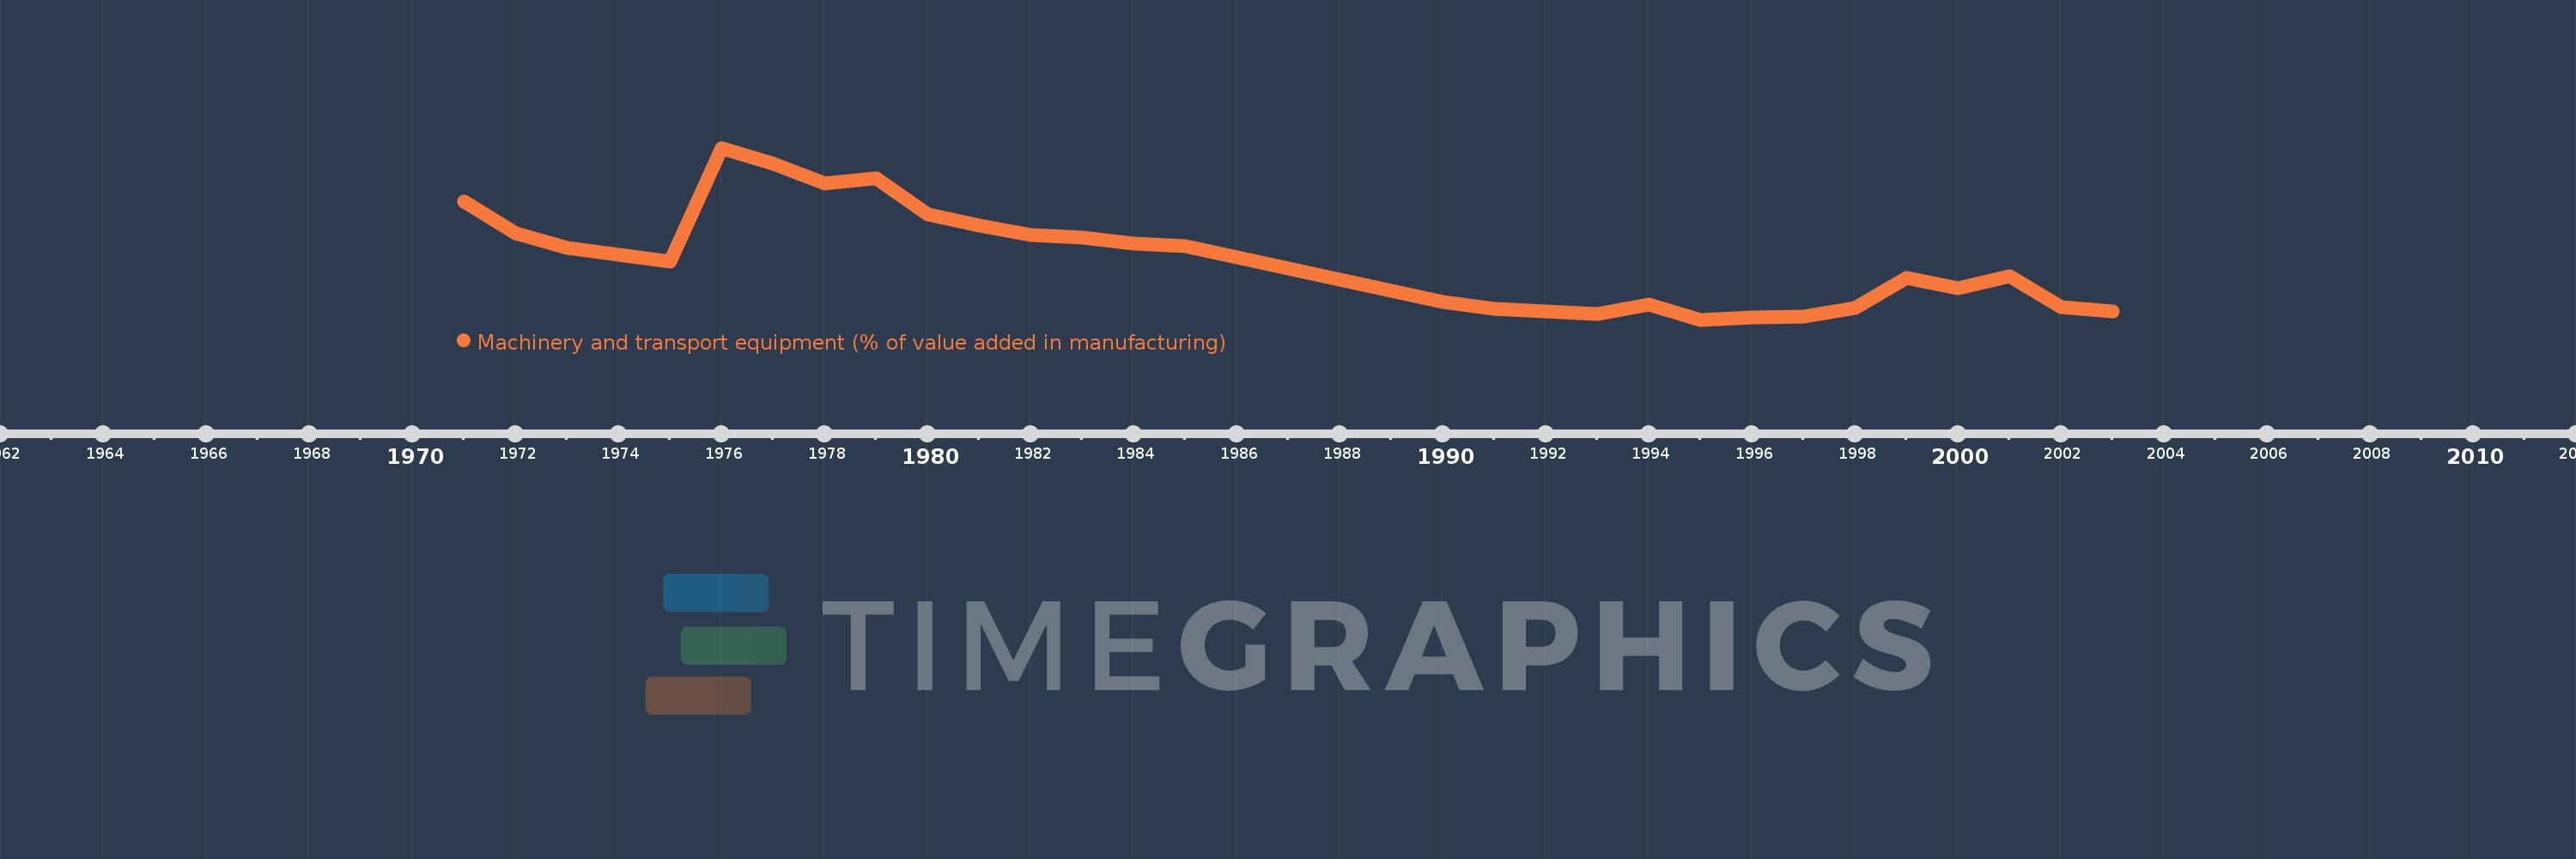
Machinery and transport equipment (% of value added in manufacturing)
2003,2002,2001,2000,1999,1998,1997,1996,1995,1994,1993,1992,1991,1990,1985,1984,1983,1982,1981,1980,1979,1978,1977,1976,1975,1973,1972,1971
