29
/fr/
fr
AIzaSyAYiBZKx7MnpbEhh9jyipgxe19OcubqV5w
April 1, 2024
97263
Cabo Verde
CPV
true
2
1
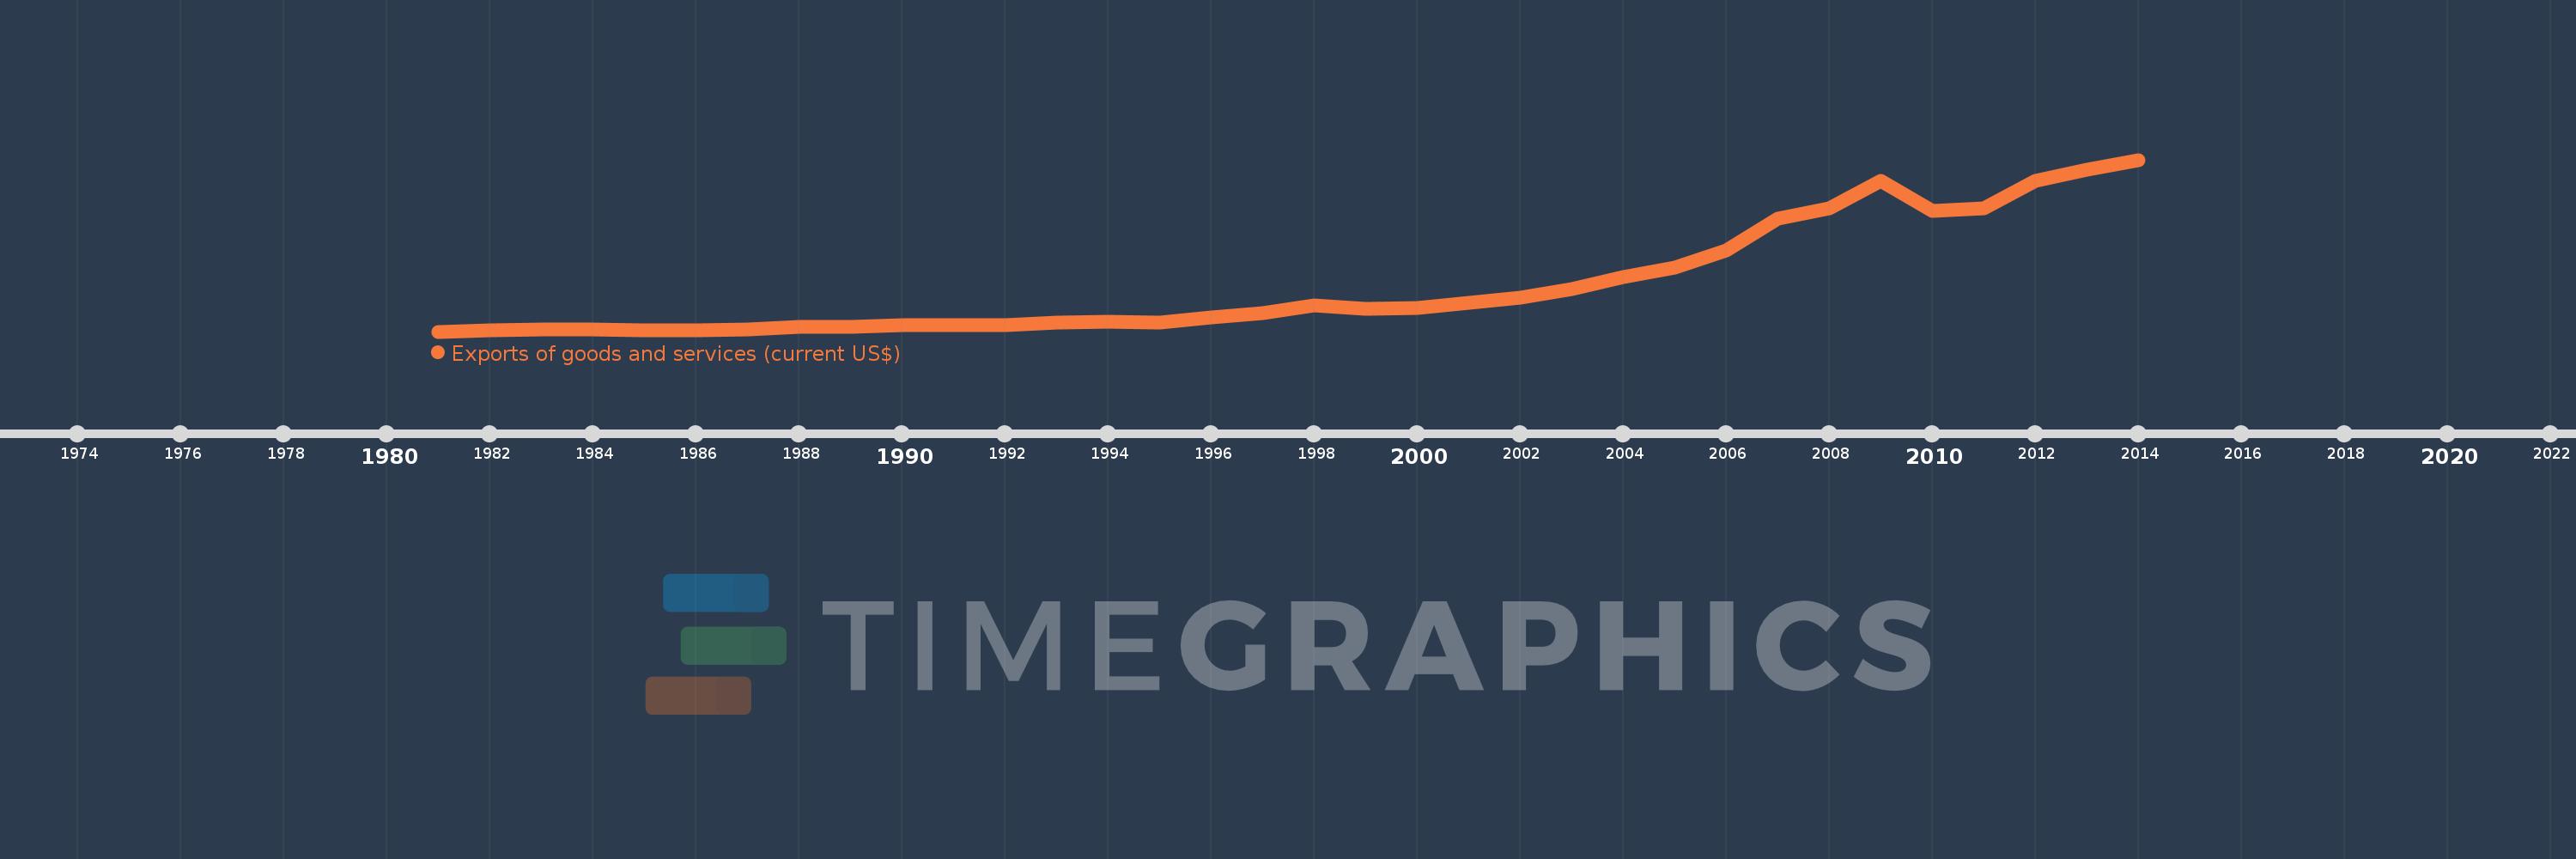
Exports of goods and services (current US$)
2014,2013,2012,2011,2010,2009,2008,2007,2006,2005,2004,2003,2002,2001,2000,1999,1998,1997,1996,1995,1994,1993,1992,1991,1990,1989,1988,1987,1986,1985,1984,1983,1982,1981
Cette statistique dans les autres pays:
AfghanistanAlbaniaAlgeriaAngolaAntigua and BarbudaArab WorldArgentinaArmeniaArubaAustraliaAustriaAzerbaijanBahamas, TheBahrainBangladeshBarbadosBelarusBelgiumBelizeBeninBermudaBhutanBoliviaBosnia and HerzegovinaBotswanaBrazilBrunei DarussalamBulgariaBurkina FasoBurundiCabo VerdeCambodiaCameroonCanadaCaribbean small statesCentral African RepublicCentral Europe and the BalticsChadChileChinaColombiaComorosCongo, Dem. Rep.Congo, Rep.Costa RicaCote d'IvoireCroatiaCubaCyprusCzech RepublicDenmarkDjiboutiDominicaDominican RepublicEarly-demographic dividendEast Asia & PacificEast Asia & Pacific (excluding high income)East Asia & Pacific (IDA & IBRD countries)EcuadorEgypt, Arab Rep.El SalvadorEquatorial GuineaEritreaEstoniaEthiopiaEuro areaEurope & Central AsiaEurope & Central Asia (excluding high income)Europe & Central Asia (IDA & IBRD countries)European UnionFaroe IslandsFijiFinlandFragile and conflict affected situationsFranceFrench PolynesiaGabonGambia, TheGeorgiaGermanyGhanaGreeceGrenadaGuatemalaGuineaGuinea-BissauGuyanaHaitiHeavily indebted poor countries (HIPC)High incomeHondurasHong Kong SAR, ChinaHungaryIBRD onlyIcelandIDA & IBRD totalIDA blendIDA onlyIDA totalIndiaIndonesiaIran, Islamic Rep.IraqIrelandIsraelItalyJamaicaJapanJordanKazakhstanKenyaKiribatiKorea, Rep.KosovoKuwaitKyrgyz RepublicLao PDRLate-demographic dividendLatin America & Caribbean Latin America & Caribbean (excluding high income)Latin America & the Caribbean (IDA & IBRD countries)LatviaLeast developed countries: UN classificationLebanonLesothoLiberiaLibyaLithuaniaLow & middle incomeLow incomeLower middle incomeLuxembourgMacao SAR, ChinaMacedonia, FYRMadagascarMalawiMalaysiaMaldivesMaliMaltaMauritaniaMauritiusMexicoMicronesia, Fed. Sts.Middle East & North AfricaMiddle East & North Africa (excluding high income)Middle East & North Africa (IDA & IBRD countries)Middle incomeMoldovaMongoliaMontenegroMoroccoMozambiqueMyanmarNamibiaNepalNetherlandsNew CaledoniaNew ZealandNicaraguaNigerNigeriaNorth AmericaNorwayOECD membersOmanOther small statesPacific island small statesPakistanPalauPanamaPapua New GuineaParaguayPeruPhilippinesPolandPortugalPost-demographic dividendPre-demographic dividendPuerto RicoQatarRomaniaRussian FederationRwandaSamoaSaudi ArabiaSenegalSerbiaSeychellesSierra LeoneSingaporeSlovak RepublicSloveniaSmall statesSolomon IslandsSomaliaSouth AfricaSouth AsiaSouth Asia (IDA & IBRD)South SudanSpainSri LankaSt. Kitts and NevisSt. LuciaSt. Vincent and the GrenadinesSub-Saharan Africa Sub-Saharan Africa (excluding high income)Sub-Saharan Africa (IDA & IBRD countries)SudanSurinameSwazilandSwedenSwitzerlandSyrian Arab RepublicTajikistanTanzaniaThailandTimor-LesteTogoTongaTrinidad and TobagoTunisiaTurkeyTurkmenistanUgandaUkraineUnited Arab EmiratesUnited KingdomUnited StatesUpper middle incomeUruguayUzbekistanVanuatuVenezuela, RBVietnamWest Bank and GazaWorldYemen, Rep.ZambiaZimbabwe La ligne de temps
Cette échelle de temps montre un graphique de 1981 année à 2014 année Cabo Verde. Les données jusqu'à 1980 année ne sont pas présentés. Quantité d'observations actuelles selon dates: 34.
Source (désignation):
Les indicateurs du développement mondiale
Source (organisation):
World Bank national accounts data, and OECD National Accounts data files.
Catégories:
Economy & Growth, Trade
Dernière mise à jour
23 avr. 2017
Les indicateurs de changement de valeurs selon les années
Minimum:
24.288 mln.
1 janv. 1981
Maximum:
749.496 mln.
1 janv. 2014
Pour la date d''observation
Valeur
Changement absolu
Le changement par rapport à la valeur précédente
1 janv. 1981
24.288 mln.
+24.288 mln.
0.0%
1 janv. 1982
29.943 mln.
+5.654 mln.
23.28%
1 janv. 1983
32.243 mln.
+2.3 mln.
7.68%
1 janv. 1984
34.104 mln.
+1.861 mln.
5.77%
1 janv. 1985
30.065 mln.
-4.039 mln.
-11.84%
1 janv. 1986
31.18 mln.
+1.115 mln.
3.71%
1 janv. 1987
33.573 mln.
+2.394 mln.
7.68%
1 janv. 1988
42.579 mln.
+9.005 mln.
26.82%
1 janv. 1989
44.16 mln.
+1.581 mln.
3.71%
1 janv. 1990
51.418 mln.
+7.258 mln.
16.44%
1 janv. 1991
52.576 mln.
+1.158 mln.
2.25%
1 janv. 1992
52.976 mln.
+399.898 milles
0.76%
1 janv. 1993
61.728 mln.
+8.752 mln.
16.52%
1 janv. 1994
65.033 mln.
+3.305 mln.
5.35%
1 janv. 1995
61.175 mln.
-3.858 mln.
-5.93%
1 janv. 1996
83.482 mln.
+22.307 mln.
36.46%
1 janv. 1997
101.396 mln.
+17.913 mln.
21.46%
1 janv. 1998
134.631 mln.
+33.236 mln.
32.78%
1 janv. 1999
118.976 mln.
-15.656 mln.
-11.63%
1 janv. 2000
124.265 mln.
+5.289 mln.
4.45%
1 janv. 2001
145.63 mln.
+21.365 mln.
17.19%
1 janv. 2002
167.834 mln.
+22.204 mln.
15.25%
1 janv. 2003
202.096 mln.
+34.262 mln.
20.41%
1 janv. 2004
255.294 mln.
+53.199 mln.
26.32%
1 janv. 2005
295.82 mln.
+40.526 mln.
15.87%
1 janv. 2006
367.187 mln.
+71.367 mln.
24.13%
1 janv. 2007
500.016 mln.
+132.828 mln.
36.17%
1 janv. 2008
545.28 mln.
+45.264 mln.
9.05%
1 janv. 2009
660.191 mln.
+114.912 mln.
21.07%
1 janv. 2010
531.989 mln.
-128.203 mln.
-19.42%
1 janv. 2011
543.736 mln.
+11.747 mln.
2.21%
1 janv. 2012
662.371 mln.
+118.636 mln.
21.82%
1 janv. 2013
708.32 mln.
+45.949 mln.
6.94%
1 janv. 2014
749.496 mln.
+41.176 mln.
5.81%
Classement des pays selon les statistiques actuelles par années


Commentaires: