29
/fr/
fr
AIzaSyAYiBZKx7MnpbEhh9jyipgxe19OcubqV5w
April 1, 2024
239225
Sierra Leone
SLE
true
2
1
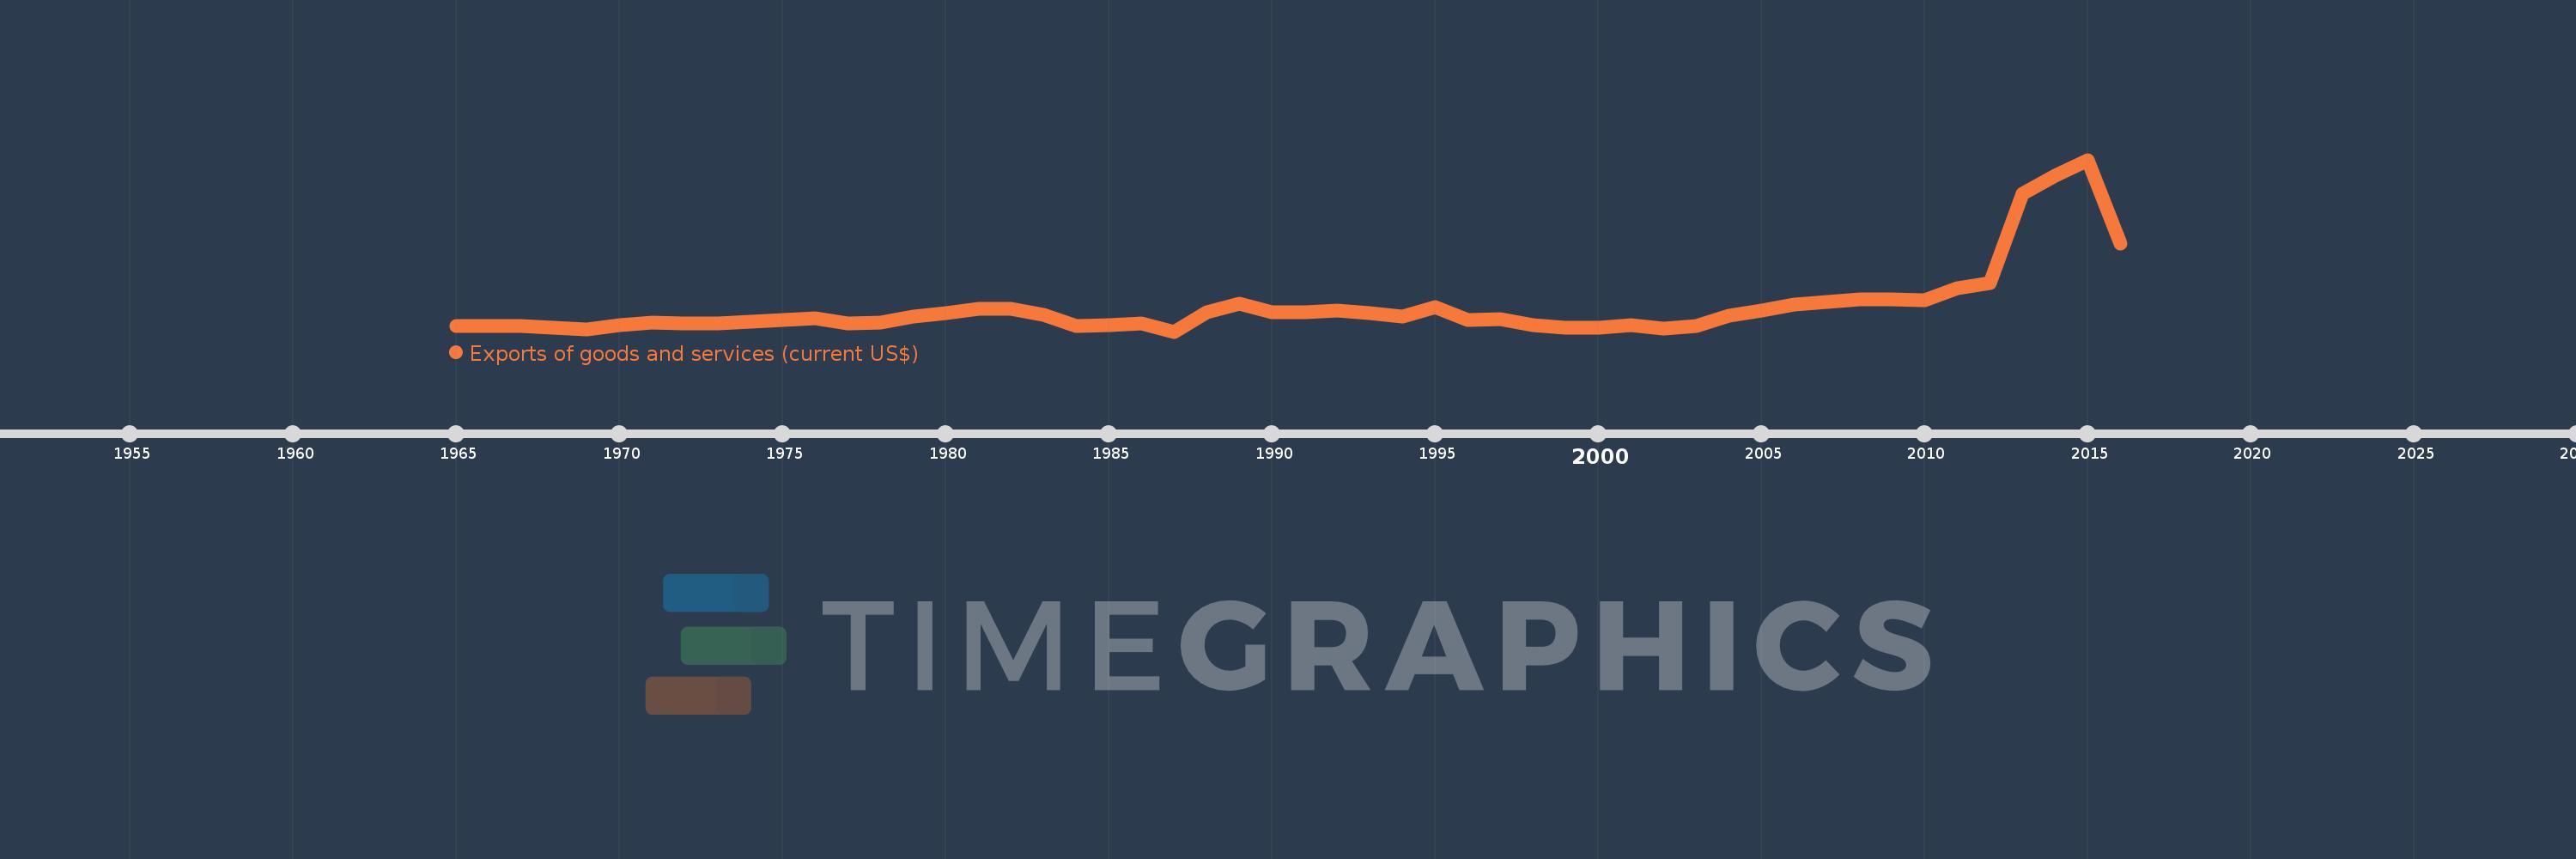
Exports of goods and services (current US$)
2016,2015,2014,2013,2012,2011,2010,2009,2008,2007,2006,2005,2004,2003,2002,2001,2000,1999,1998,1997,1996,1995,1994,1993,1992,1991,1990,1989,1988,1987,1986,1985,1984,1983,1982,1981,1980,1979,1978,1977,1976,1975,1974,1973,1972,1971,1970,1969,1968,1967,1966,1965
Cette statistique dans les autres pays:
AfghanistanAlbaniaAlgeriaAngolaAntigua and BarbudaArab WorldArgentinaArmeniaArubaAustraliaAustriaAzerbaijanBahamas, TheBahrainBangladeshBarbadosBelarusBelgiumBelizeBeninBermudaBhutanBoliviaBosnia and HerzegovinaBotswanaBrazilBrunei DarussalamBulgariaBurkina FasoBurundiCabo VerdeCambodiaCameroonCanadaCaribbean small statesCentral African RepublicCentral Europe and the BalticsChadChileChinaColombiaComorosCongo, Dem. Rep.Congo, Rep.Costa RicaCote d'IvoireCroatiaCubaCyprusCzech RepublicDenmarkDjiboutiDominicaDominican RepublicEarly-demographic dividendEast Asia & PacificEast Asia & Pacific (excluding high income)East Asia & Pacific (IDA & IBRD countries)EcuadorEgypt, Arab Rep.El SalvadorEquatorial GuineaEritreaEstoniaEthiopiaEuro areaEurope & Central AsiaEurope & Central Asia (excluding high income)Europe & Central Asia (IDA & IBRD countries)European UnionFaroe IslandsFijiFinlandFragile and conflict affected situationsFranceFrench PolynesiaGabonGambia, TheGeorgiaGermanyGhanaGreeceGrenadaGuatemalaGuineaGuinea-BissauGuyanaHaitiHeavily indebted poor countries (HIPC)High incomeHondurasHong Kong SAR, ChinaHungaryIBRD onlyIcelandIDA & IBRD totalIDA blendIDA onlyIDA totalIndiaIndonesiaIran, Islamic Rep.IraqIrelandIsraelItalyJamaicaJapanJordanKazakhstanKenyaKiribatiKorea, Rep.KosovoKuwaitKyrgyz RepublicLao PDRLate-demographic dividendLatin America & Caribbean Latin America & Caribbean (excluding high income)Latin America & the Caribbean (IDA & IBRD countries)LatviaLeast developed countries: UN classificationLebanonLesothoLiberiaLibyaLithuaniaLow & middle incomeLow incomeLower middle incomeLuxembourgMacao SAR, ChinaMacedonia, FYRMadagascarMalawiMalaysiaMaldivesMaliMaltaMauritaniaMauritiusMexicoMicronesia, Fed. Sts.Middle East & North AfricaMiddle East & North Africa (excluding high income)Middle East & North Africa (IDA & IBRD countries)Middle incomeMoldovaMongoliaMontenegroMoroccoMozambiqueMyanmarNamibiaNepalNetherlandsNew CaledoniaNew ZealandNicaraguaNigerNigeriaNorth AmericaNorwayOECD membersOmanOther small statesPacific island small statesPakistanPalauPanamaPapua New GuineaParaguayPeruPhilippinesPolandPortugalPost-demographic dividendPre-demographic dividendPuerto RicoQatarRomaniaRussian FederationRwandaSamoaSaudi ArabiaSenegalSerbiaSeychellesSierra LeoneSingaporeSlovak RepublicSloveniaSmall statesSolomon IslandsSomaliaSouth AfricaSouth AsiaSouth Asia (IDA & IBRD)South SudanSpainSri LankaSt. Kitts and NevisSt. LuciaSt. Vincent and the GrenadinesSub-Saharan Africa Sub-Saharan Africa (excluding high income)Sub-Saharan Africa (IDA & IBRD countries)SudanSurinameSwazilandSwedenSwitzerlandSyrian Arab RepublicTajikistanTanzaniaThailandTimor-LesteTogoTongaTrinidad and TobagoTunisiaTurkeyTurkmenistanUgandaUkraineUnited Arab EmiratesUnited KingdomUnited StatesUpper middle incomeUruguayUzbekistanVanuatuVenezuela, RBVietnamWest Bank and GazaWorldYemen, Rep.ZambiaZimbabwe La ligne de temps
Cette échelle de temps montre un graphique de 1965 année à 2016 année Sierra Leone. Les données jusqu'à 1964 année ne sont pas présentés. Quantité d'observations actuelles selon dates: 52.
Source (désignation):
Les indicateurs du développement mondiale
Source (organisation):
World Bank national accounts data, and OECD National Accounts data files.
Catégories:
Economy & Growth, Trade
Dernière mise à jour
23 avr. 2017
Les indicateurs de changement de valeurs selon les années
Minimum:
58.414 mln.
1 janv. 1987
Maximum:
1.543 mds
1 janv. 2015
Pour la date d''observation
Valeur
Changement absolu
Le changement par rapport à la valeur précédente
1 janv. 1965
108.122 mln.
+108.122 mln.
0.0%
1 janv. 1966
103.74 mln.
-4.382 mln.
-4.05%
1 janv. 1967
104.3 mln.
+560.0 milles
0.54%
1 janv. 1968
94.448 mln.
-9.852 mln.
-9.45%
1 janv. 1969
78.12 mln.
-16.328 mln.
-17.29%
1 janv. 1970
112.92 mln.
+34.8 mln.
44.55%
1 janv. 1971
134.76 mln.
+21.84 mln.
19.34%
1 janv. 1972
131.184 mln.
-3.576 mln.
-2.65%
1 janv. 1973
129.249 mln.
-1.935 mln.
-1.48%
1 janv. 1974
141.73 mln.
+12.481 mln.
9.66%
1 janv. 1975
156.29 mln.
+14.56 mln.
10.27%
1 janv. 1976
170.571 mln.
+14.281 mln.
9.14%
1 janv. 1977
128.141 mln.
-42.43 mln.
-24.88%
1 janv. 1978
136.415 mln.
+8.275 mln.
6.46%
1 janv. 1979
190.442 mln.
+54.026 mln.
39.6%
1 janv. 1980
220.82 mln.
+30.378 mln.
15.95%
1 janv. 1981
251.667 mln.
+30.847 mln.
13.97%
1 janv. 1982
256.578 mln.
+4.911 mln.
1.95%
1 janv. 1983
204.093 mln.
-52.485 mln.
-20.46%
1 janv. 1984
110.166 mln.
-93.927 mln.
-46.02%
1 janv. 1985
115.54 mln.
+5.374 mln.
4.88%
1 janv. 1986
127.012 mln.
+11.472 mln.
9.93%
1 janv. 1987
58.414 mln.
-68.598 mln.
-54.01%
1 janv. 1988
224.168 mln.
+165.753 mln.
283.76%
1 janv. 1989
303.069 mln.
+78.902 mln.
35.2%
1 janv. 1990
223.145 mln.
-79.924 mln.
-26.37%
1 janv. 1991
225.361 mln.
+2.216 mln.
0.99%
1 janv. 1992
243.739 mln.
+18.378 mln.
8.16%
1 janv. 1993
214.818 mln.
-28.922 mln.
-11.87%
1 janv. 1994
186.687 mln.
-28.131 mln.
-13.1%
1 janv. 1995
269.121 mln.
+82.433 mln.
44.16%
1 janv. 1996
161.86 mln.
-107.26 mln.
-39.86%
1 janv. 1997
164.289 mln.
+2.429 mln.
1.5%
1 janv. 1998
112.226 mln.
-52.063 mln.
-31.69%
1 janv. 1999
94.547 mln.
-17.68 mln.
-15.75%
1 janv. 2000
92.562 mln.
-1.985 mln.
-2.1%
1 janv. 2001
115.315 mln.
+22.753 mln.
24.58%
1 janv. 2002
85.492 mln.
-29.823 mln.
-25.86%
1 janv. 2003
107.153 mln.
+21.661 mln.
25.34%
1 janv. 2004
192.923 mln.
+85.77 mln.
80.04%
1 janv. 2005
238.584 mln.
+45.661 mln.
23.67%
1 janv. 2006
290.042 mln.
+51.458 mln.
21.57%
1 janv. 2007
317.931 mln.
+27.889 mln.
9.62%
1 janv. 2008
336.803 mln.
+18.871 mln.
5.94%
1 janv. 2009
338.718 mln.
+1.915 mln.
0.57%
1 janv. 2010
331.271 mln.
-7.447 mln.
-2.2%
1 janv. 2011
432.979 mln.
+101.708 mln.
30.7%
1 janv. 2012
478.655 mln.
+45.676 mln.
10.55%
1 janv. 2013
1.251 mds
+772.36 mln.
161.36%
1 janv. 2014
1.409 mds
+157.519 mln.
12.59%
1 janv. 2015
1.543 mds
+134.13 mln.
9.52%
1 janv. 2016
816.089 mln.
-726.576 mln.
-47.1%
Classement des pays selon les statistiques actuelles par années


Commentaires: