29
/fr/
fr
AIzaSyAYiBZKx7MnpbEhh9jyipgxe19OcubqV5w
April 1, 2024
93957
Bulgaria
BGR
true
2
1
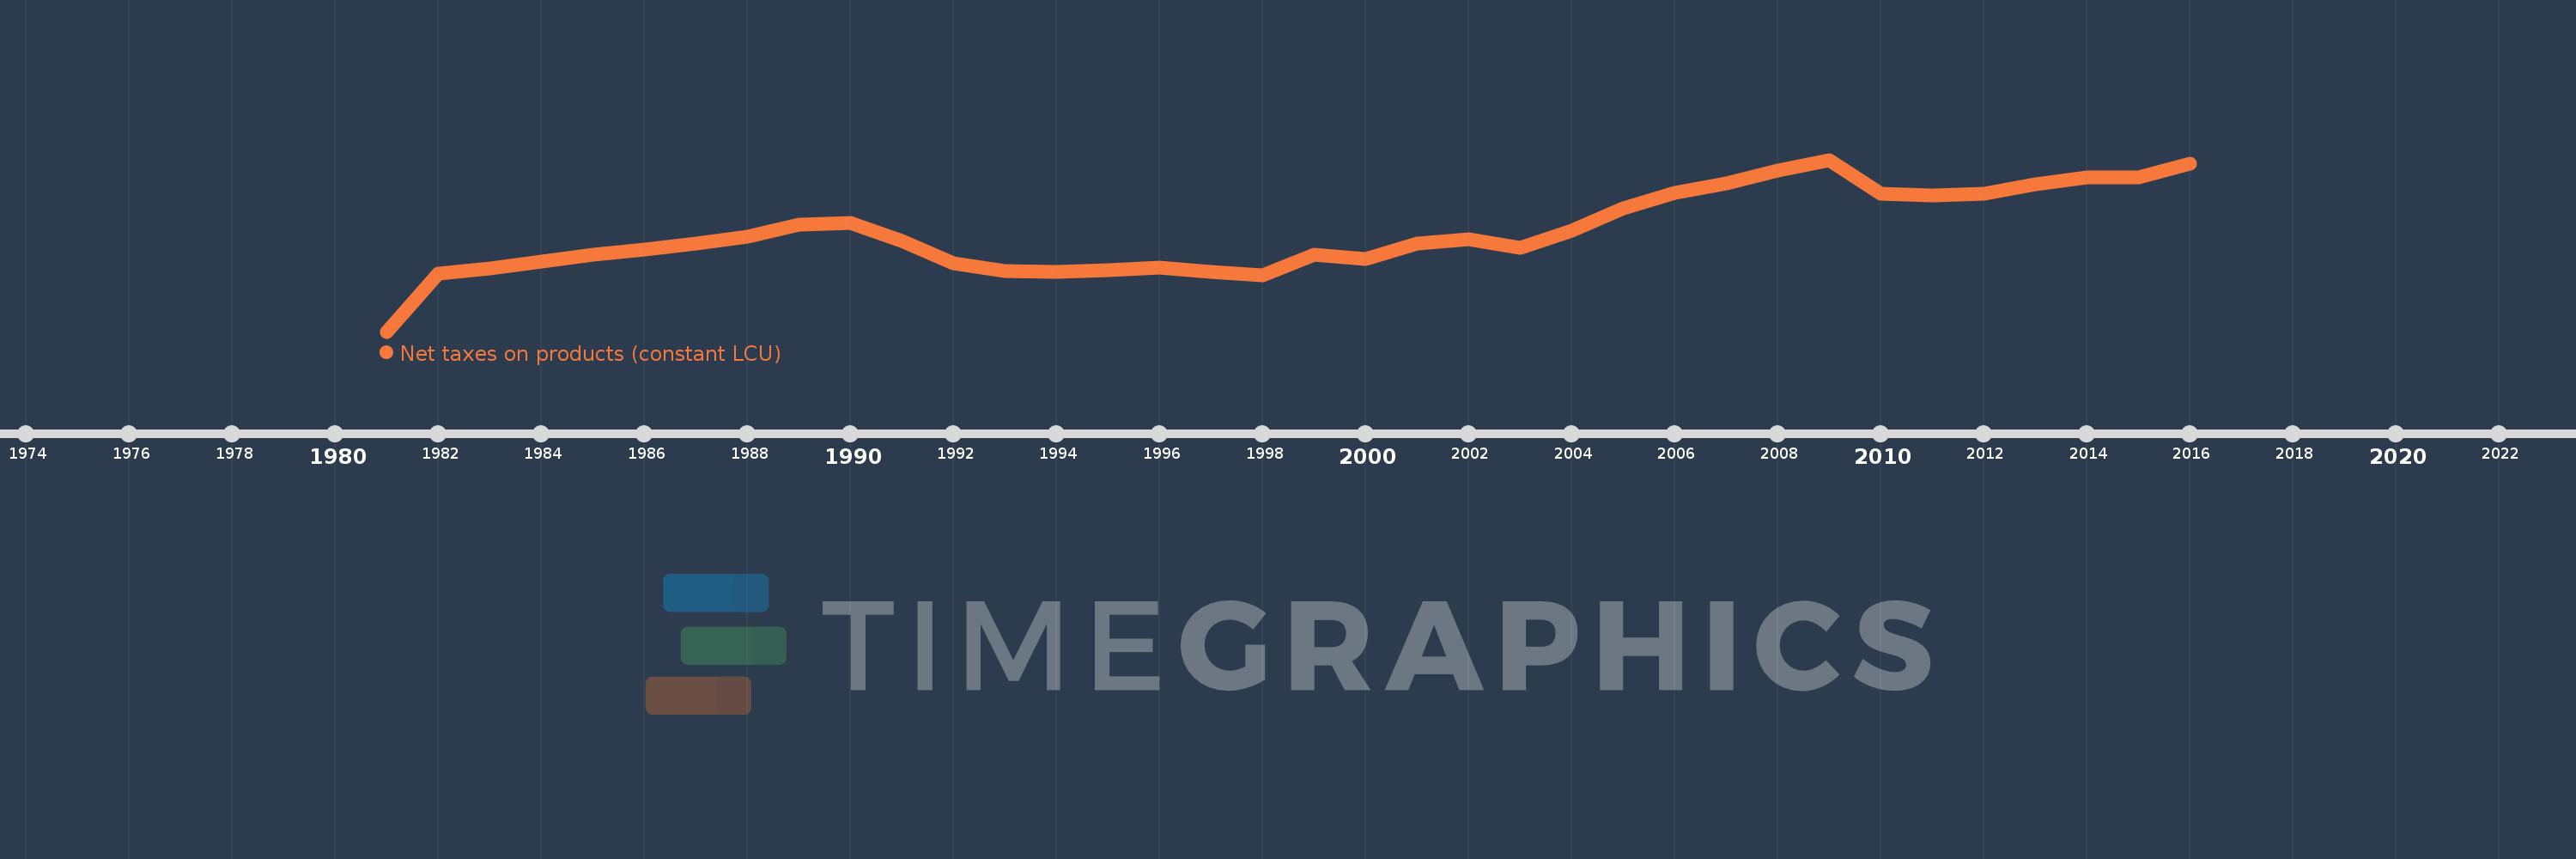
Net taxes on products (constant LCU)
2016,2015,2014,2013,2012,2011,2010,2009,2008,2007,2006,2005,2004,2003,2002,2001,2000,1999,1998,1997,1996,1995,1994,1993,1992,1991,1990,1989,1988,1987,1986,1985,1984,1983,1982,1981
Cette statistique dans les autres pays:
La ligne de temps
Cette échelle de temps montre un graphique de 1981 année à 2016 année Bulgaria. Les données jusqu'à 1980 année ne sont pas présentés. Quantité d'observations actuelles selon dates: 36.
Source (désignation):
Les indicateurs du développement mondiale
Source (organisation):
World Bank national accounts data, and OECD National Accounts data files.
Catégories:
Economy & Growth
Dernière mise à jour
23 avr. 2017
Les indicateurs de changement de valeurs selon les années
Minimum:
1.848 mds
1 janv. 1981
Maximum:
11.787 mds
1 janv. 2009
Pour la date d''observation
Valeur
Changement absolu
Le changement par rapport à la valeur précédente
1 janv. 1981
1.848 mds
+1.848 mds
0.0%
1 janv. 1982
5.199 mds
+3.351 mds
181.38%
1 janv. 1983
5.502 mds
+302.924 mln.
5.83%
1 janv. 1984
5.922 mds
+420.278 mln.
7.64%
1 janv. 1985
6.285 mds
+363.091 mln.
6.13%
1 janv. 1986
6.605 mds
+320.163 mln.
5.09%
1 janv. 1987
6.948 mds
+343.001 mln.
5.19%
1 janv. 1988
7.322 mds
+373.381 mln.
5.37%
1 janv. 1989
8.047 mds
+725.877 mln.
9.91%
1 janv. 1990
8.125 mds
+77.675 mln.
0.97%
1 janv. 1991
7.106 mds
-1.019 mds
-12.54%
1 janv. 1992
5.785 mds
-1.321 mds
-18.59%
1 janv. 1993
5.365 mds
-419.536 mln.
-7.25%
1 janv. 1994
5.286 mds
-79.427 mln.
-1.48%
1 janv. 1995
5.382 mds
+96.106 mln.
1.82%
1 janv. 1996
5.536 mds
+153.941 mln.
2.86%
1 janv. 1997
5.281 mds
-254.659 mln.
-4.6%
1 janv. 1998
5.102 mds
-179.4 mln.
-3.4%
1 janv. 1999
6.282 mds
+1.18 mds
23.13%
1 janv. 2000
6.05 mds
-231.9 mln.
-3.69%
1 janv. 2001
6.936 mds
+886.1 mln.
14.65%
1 janv. 2002
7.189 mds
+253.1 mln.
3.65%
1 janv. 2003
6.691 mds
-498.6 mln.
-6.94%
1 janv. 2004
7.679 mds
+988.4 mln.
14.77%
1 janv. 2005
8.985 mds
+1.306 mds
17.01%
1 janv. 2006
9.897 mds
+912.3 mln.
10.15%
1 janv. 2007
10.441 mds
+543.3 mln.
5.49%
1 janv. 2008
11.153 mds
+712.1 mln.
6.82%
1 janv. 2009
11.787 mds
+634.6 mln.
5.69%
1 janv. 2010
9.84 mds
-1.948 mds
-16.52%
1 janv. 2011
9.749 mds
-91.0 mln.
-0.92%
1 janv. 2012
9.813 mds
+63.7 mln.
0.65%
1 janv. 2013
10.377 mds
+564.6 mln.
5.75%
1 janv. 2014
10.749 mds
+372.0 mln.
3.58%
1 janv. 2015
10.764 mds
+14.6 mln.
0.14%
1 janv. 2016
11.568 mds
+803.8 mln.
7.47%
Classement des pays selon les statistiques actuelles par années


Commentaires: