29
/fr/
fr
AIzaSyAYiBZKx7MnpbEhh9jyipgxe19OcubqV5w
April 1, 2024
76495
Bahamas, The
BHS
true
2
1
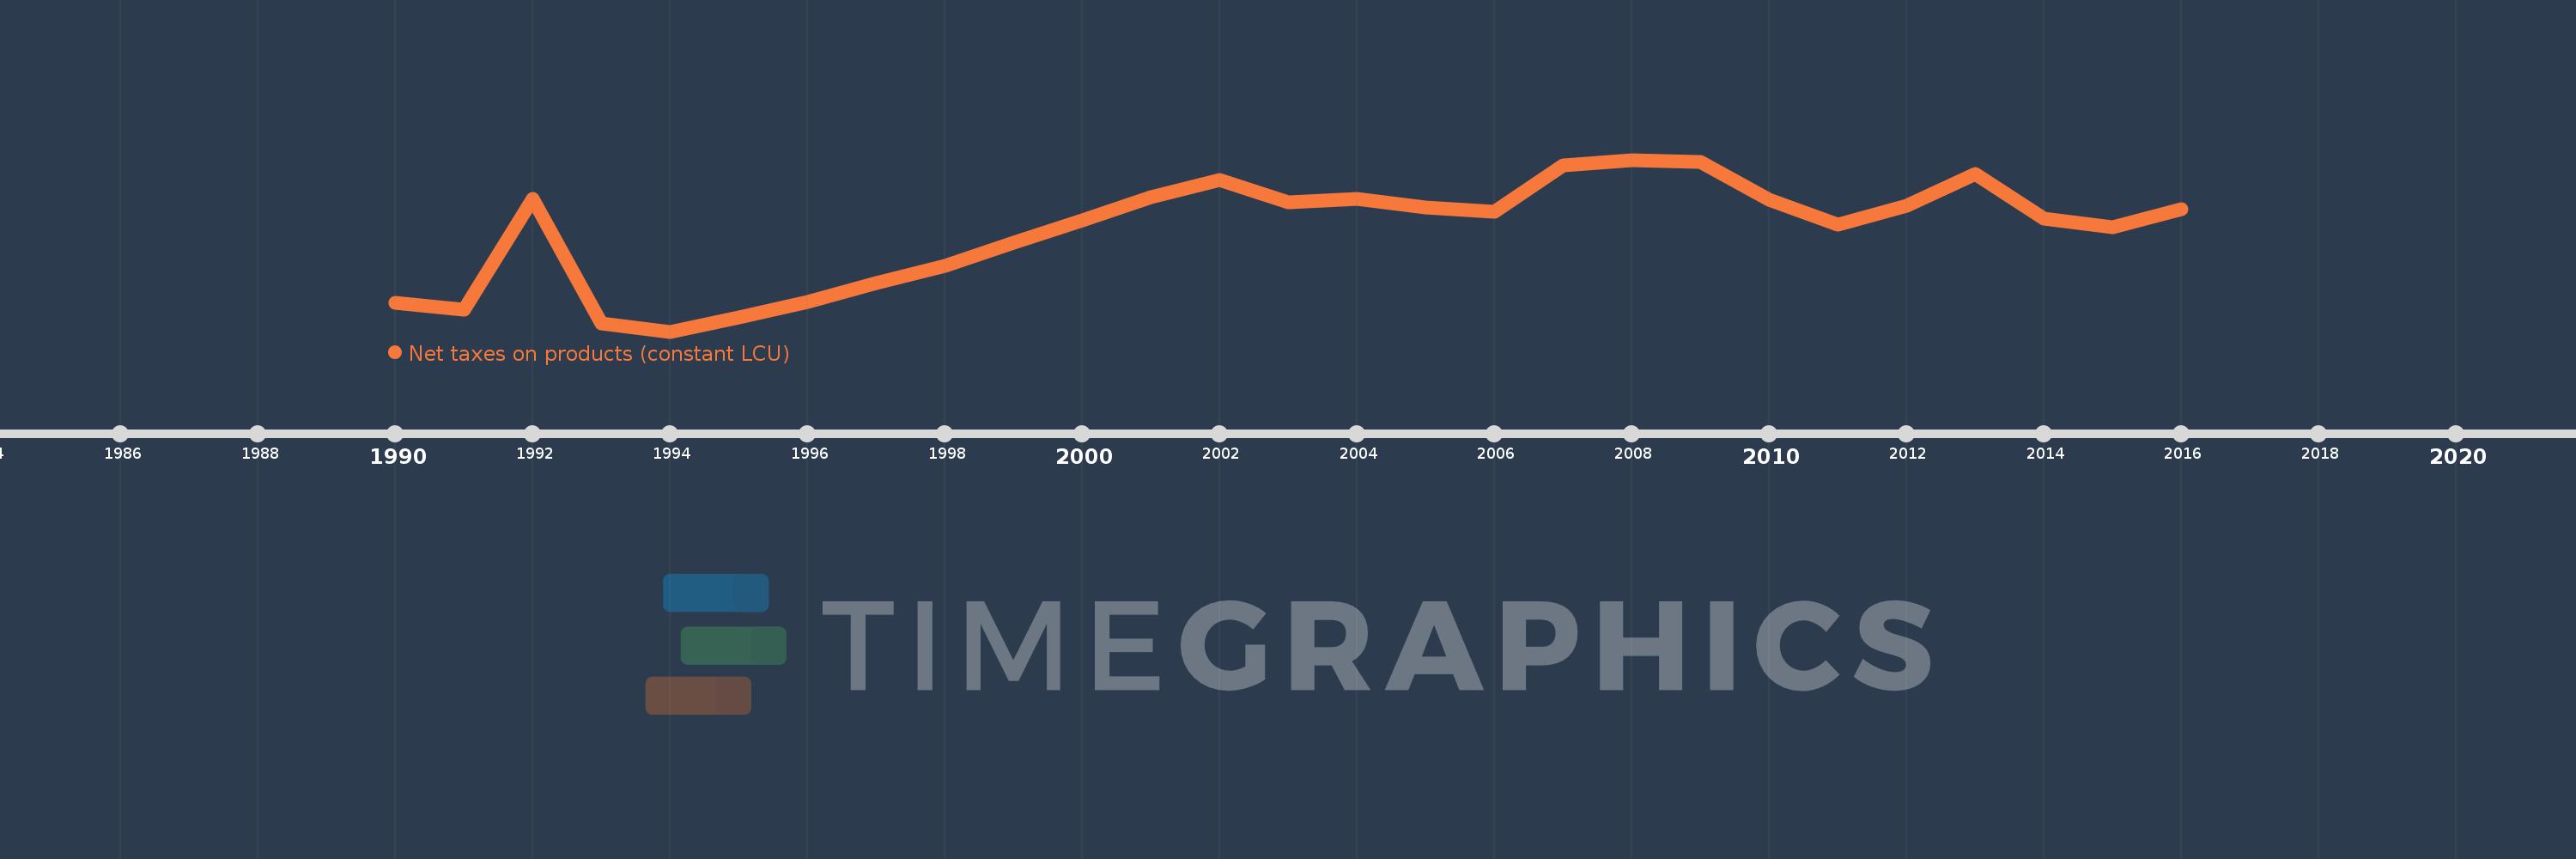
Net taxes on products (constant LCU)
2016,2015,2014,2013,2012,2011,2010,2009,2008,2007,2006,2005,2004,2003,2002,2001,2000,1999,1998,1997,1996,1995,1994,1993,1992,1991,1990
Cette statistique dans les autres pays:
La ligne de temps
Cette échelle de temps montre un graphique de 1990 année à 2016 année Bahamas, The. Les données jusqu'à 1989 année ne sont pas présentés. Quantité d'observations actuelles selon dates: 27.
Source (désignation):
Les indicateurs du développement mondiale
Source (organisation):
World Bank national accounts data, and OECD National Accounts data files.
Catégories:
Economy & Growth
Dernière mise à jour
23 avr. 2017
Les indicateurs de changement de valeurs selon les années
Minimum:
324.241 mln.
1 janv. 1994
Maximum:
615.382 mln.
1 janv. 2008
Pour la date d''observation
Valeur
Changement absolu
Le changement par rapport à la valeur précédente
1 janv. 1990
372.617 mln.
+372.617 mln.
0.0%
1 janv. 1991
361.547 mln.
-11.07 mln.
-2.97%
1 janv. 1992
549.631 mln.
+188.084 mln.
52.02%
1 janv. 1993
338.356 mln.
-211.275 mln.
-38.44%
1 janv. 1994
324.241 mln.
-14.115 mln.
-4.17%
1 janv. 1995
348.749 mln.
+24.508 mln.
7.56%
1 janv. 1996
374.961 mln.
+26.212 mln.
7.52%
1 janv. 1997
406.104 mln.
+31.143 mln.
8.31%
1 janv. 1998
435.71 mln.
+29.606 mln.
7.29%
1 janv. 1999
474.953 mln.
+39.243 mln.
9.01%
1 janv. 2000
512.345 mln.
+37.392 mln.
7.87%
1 janv. 2001
552.331 mln.
+39.986 mln.
7.8%
1 janv. 2002
581.387 mln.
+29.056 mln.
5.26%
1 janv. 2003
542.78 mln.
-38.607 mln.
-6.64%
1 janv. 2004
548.837 mln.
+6.057 mln.
1.12%
1 janv. 2005
534.57 mln.
-14.267 mln.
-2.6%
1 janv. 2006
526.794 mln.
-7.776 mln.
-1.45%
1 janv. 2007
605.791 mln.
+78.997 mln.
15.0%
1 janv. 2008
615.382 mln.
+9.591 mln.
1.58%
1 janv. 2009
611.598 mln.
-3.784 mln.
-0.61%
1 janv. 2010
547.27 mln.
-64.328 mln.
-10.52%
1 janv. 2011
506.168 mln.
-41.102 mln.
-7.51%
1 janv. 2012
537.059 mln.
+30.891 mln.
6.1%
1 janv. 2013
590.695 mln.
+53.636 mln.
9.99%
1 janv. 2014
515.827 mln.
-74.868 mln.
-12.67%
1 janv. 2015
501.426 mln.
-14.401 mln.
-2.79%
1 janv. 2016
531.809 mln.
+30.383 mln.
6.06%
Classement des pays selon les statistiques actuelles par années


Commentaires: