29
/fr/
fr
AIzaSyAYiBZKx7MnpbEhh9jyipgxe19OcubqV5w
April 1, 2024
87257
Bolivia
BOL
true
2
1
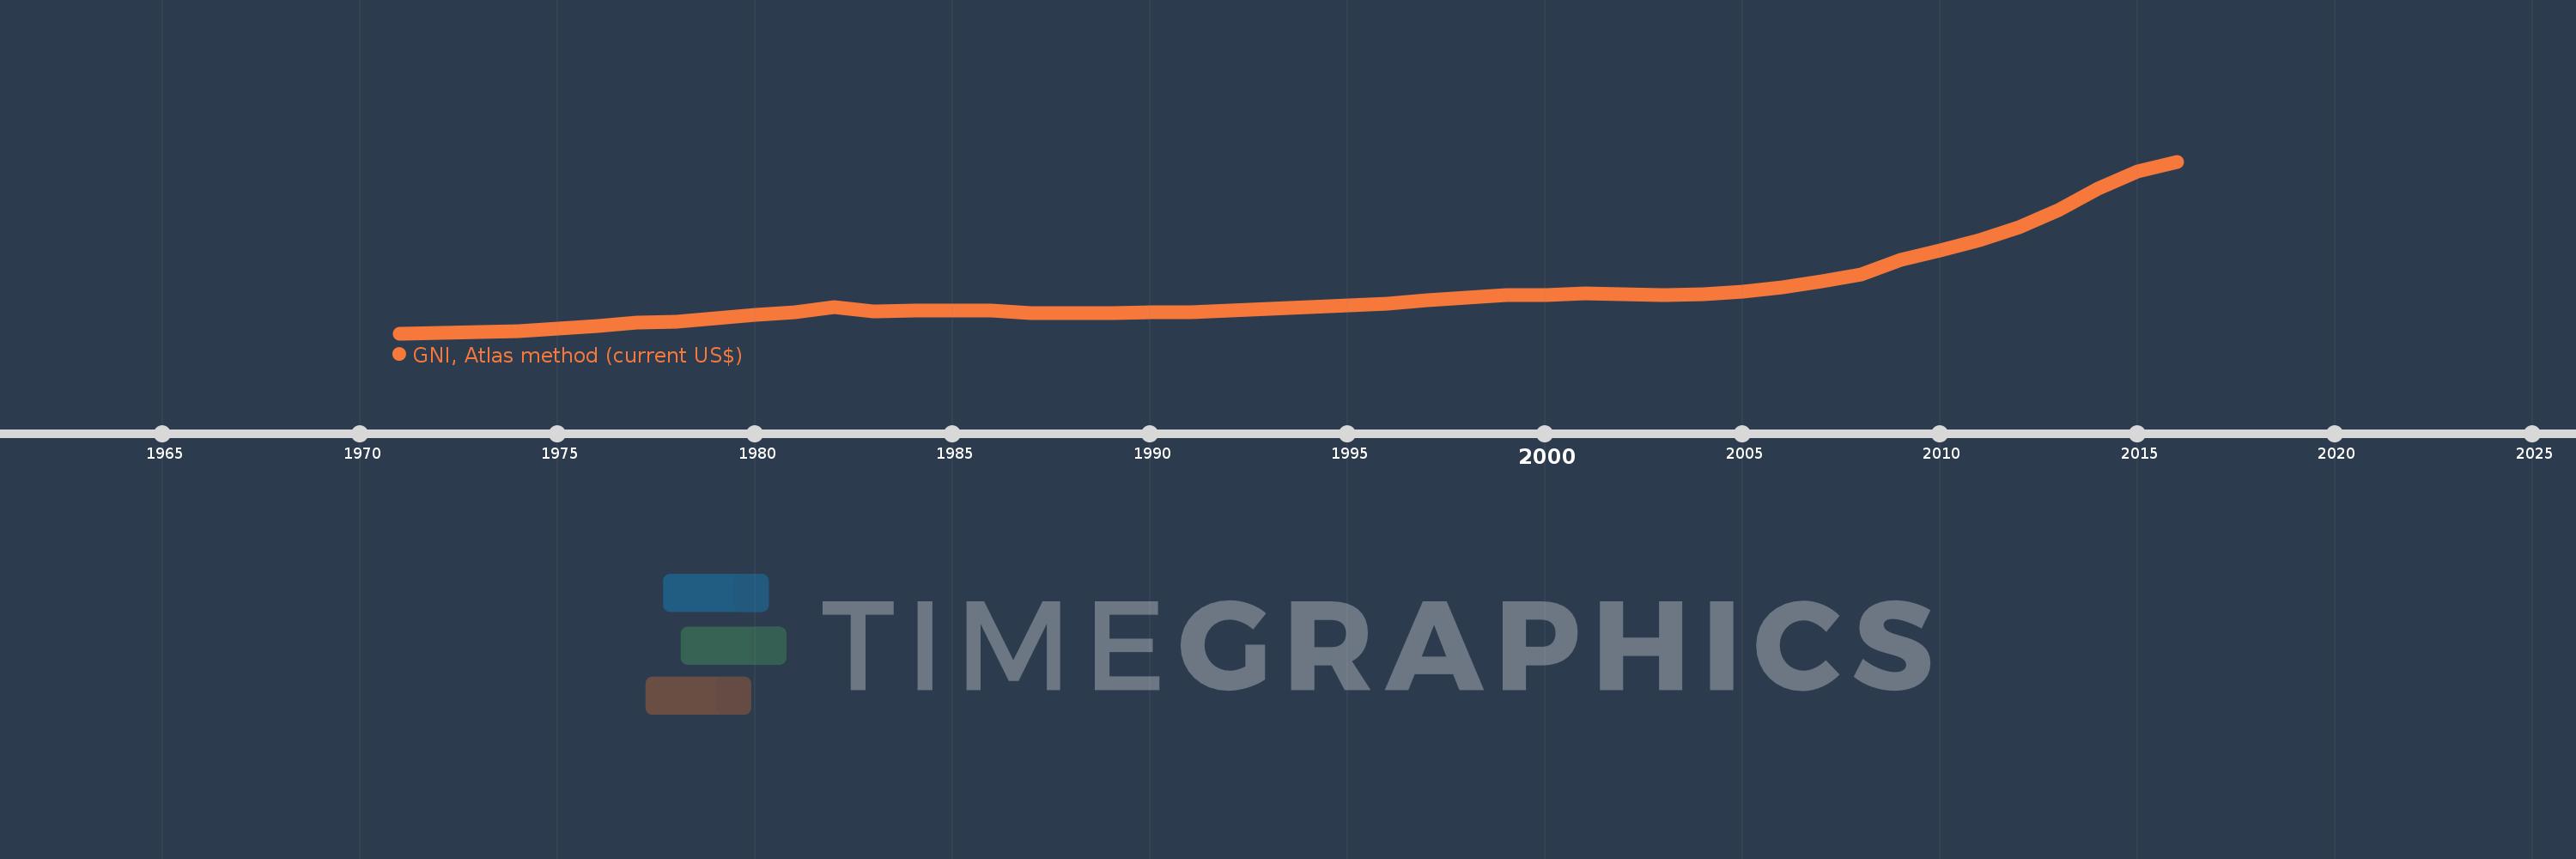
GNI, Atlas method (current US$)
2016,2015,2014,2013,2012,2011,2010,2009,2008,2007,2006,2005,2004,2003,2002,2001,2000,1999,1998,1997,1996,1995,1994,1993,1992,1991,1990,1989,1988,1987,1986,1985,1984,1983,1982,1981,1980,1979,1978,1977,1976,1975,1974,1973,1972,1971
Cette statistique dans les autres pays:
AfghanistanAlbaniaAlgeriaAndorraAngolaAntigua and BarbudaArab WorldArgentinaArmeniaAustraliaAustriaAzerbaijanBahamas, TheBahrainBangladeshBarbadosBelarusBelgiumBelizeBeninBermudaBhutanBoliviaBosnia and HerzegovinaBotswanaBrazilBrunei DarussalamBulgariaBurkina FasoBurundiCabo VerdeCambodiaCameroonCanadaCaribbean small statesCentral African RepublicCentral Europe and the BalticsChadChannel IslandsChileChinaColombiaComorosCongo, Dem. Rep.Congo, Rep.Costa RicaCote d'IvoireCroatiaCubaCyprusCzech RepublicDenmarkDjiboutiDominicaDominican RepublicEarly-demographic dividendEast Asia & PacificEast Asia & Pacific (excluding high income)East Asia & Pacific (IDA & IBRD countries)EcuadorEgypt, Arab Rep.El SalvadorEquatorial GuineaEritreaEstoniaEthiopiaEuro areaEurope & Central AsiaEurope & Central Asia (excluding high income)Europe & Central Asia (IDA & IBRD countries)European UnionFijiFinlandFragile and conflict affected situationsFranceFrench PolynesiaGabonGambia, TheGeorgiaGermanyGhanaGreeceGreenlandGrenadaGuatemalaGuineaGuinea-BissauGuyanaHaitiHeavily indebted poor countries (HIPC)High incomeHondurasHong Kong SAR, ChinaHungaryIBRD onlyIcelandIDA & IBRD totalIDA blendIDA onlyIDA totalIndiaIndonesiaIran, Islamic Rep.IraqIrelandIsle of ManIsraelItalyJamaicaJapanJordanKazakhstanKenyaKiribatiKorea, Rep.KosovoKuwaitKyrgyz RepublicLao PDRLate-demographic dividendLatin America & Caribbean Latin America & Caribbean (excluding high income)Latin America & the Caribbean (IDA & IBRD countries)LatviaLeast developed countries: UN classificationLebanonLesothoLiberiaLibyaLiechtensteinLithuaniaLow & middle incomeLow incomeLower middle incomeLuxembourgMacao SAR, ChinaMacedonia, FYRMadagascarMalawiMalaysiaMaldivesMaliMaltaMarshall IslandsMauritaniaMauritiusMexicoMicronesia, Fed. Sts.Middle East & North AfricaMiddle East & North Africa (excluding high income)Middle East & North Africa (IDA & IBRD countries)Middle incomeMoldovaMonacoMongoliaMontenegroMoroccoMozambiqueMyanmarNamibiaNauruNepalNetherlandsNew CaledoniaNew ZealandNicaraguaNigerNigeriaNorth AmericaNorwayOECD membersOmanOther small statesPacific island small statesPakistanPalauPanamaPapua New GuineaParaguayPeruPhilippinesPolandPortugalPost-demographic dividendPre-demographic dividendPuerto RicoQatarRomaniaRussian FederationRwandaSamoaSan MarinoSao Tome and PrincipeSaudi ArabiaSenegalSerbiaSeychellesSierra LeoneSingaporeSlovak RepublicSloveniaSmall statesSolomon IslandsSouth AfricaSouth AsiaSouth Asia (IDA & IBRD)South SudanSpainSri LankaSt. Kitts and NevisSt. LuciaSt. Vincent and the GrenadinesSub-Saharan Africa Sub-Saharan Africa (excluding high income)Sub-Saharan Africa (IDA & IBRD countries)SudanSurinameSwazilandSwedenSwitzerlandSyrian Arab RepublicTajikistanTanzaniaThailandTimor-LesteTogoTongaTrinidad and TobagoTunisiaTurkeyTurkmenistanTuvaluUgandaUkraineUnited Arab EmiratesUnited KingdomUnited StatesUpper middle incomeUruguayUzbekistanVanuatuVenezuela, RBVietnamVirgin Islands (U.S.)West Bank and GazaWorldYemen, Rep.ZambiaZimbabwe La ligne de temps
Cette échelle de temps montre un graphique de 1971 année à 2016 année Bolivia. Les données jusqu'à 1970 année ne sont pas présentés. Quantité d'observations actuelles selon dates: 46.
Source (désignation):
Les indicateurs du développement mondiale
Source (organisation):
World Bank national accounts data, and OECD National Accounts data files.
Catégories:
Economy & Growth
Dernière mise à jour
23 avr. 2017
Les indicateurs de changement de valeurs selon les années
Minimum:
1.06 mds
1 janv. 1971
Maximum:
32.16 mds
1 janv. 2016
Pour la date d''observation
Valeur
Changement absolu
Le changement par rapport à la valeur précédente
1 janv. 1971
1.06 mds
+1.06 mds
0.0%
1 janv. 1972
1.171 mds
+110.669 mln.
10.44%
1 janv. 1973
1.345 mds
+174.424 mln.
14.9%
1 janv. 1974
1.51 mds
+164.648 mln.
12.24%
1 janv. 1975
1.91 mds
+400.366 mln.
26.52%
1 janv. 1976
2.432 mds
+521.656 mln.
27.31%
1 janv. 1977
2.952 mds
+520.187 mln.
21.39%
1 janv. 1978
3.234 mds
+282.348 mln.
9.57%
1 janv. 1979
3.719 mds
+484.65 mln.
14.99%
1 janv. 1980
4.405 mds
+686.489 mln.
18.46%
1 janv. 1981
4.872 mds
+466.555 mln.
10.59%
1 janv. 1982
5.877 mds
+1.005 mds
20.64%
1 janv. 1983
5.039 mds
-838.143 mln.
-14.26%
1 janv. 1984
5.164 mds
+125.234 mln.
2.49%
1 janv. 1985
5.143 mds
-21.127 mln.
-0.41%
1 janv. 1986
5.105 mds
-38.499 mln.
-0.75%
1 janv. 1987
4.673 mds
-431.853 mln.
-8.46%
1 janv. 1988
4.649 mds
-24.03 mln.
-0.51%
1 janv. 1989
4.698 mds
+48.784 mln.
1.05%
1 janv. 1990
4.846 mds
+147.932 mln.
3.15%
1 janv. 1991
4.944 mds
+98.073 mln.
2.02%
1 janv. 1992
5.192 mds
+248.762 mln.
5.03%
1 janv. 1993
5.508 mds
+315.819 mln.
6.08%
1 janv. 1994
5.788 mds
+279.336 mln.
5.07%
1 janv. 1995
6.071 mds
+283.343 mln.
4.9%
1 janv. 1996
6.467 mds
+396.485 mln.
6.53%
1 janv. 1997
7.039 mds
+571.849 mln.
8.84%
1 janv. 1998
7.563 mds
+523.653 mln.
7.44%
1 janv. 1999
8.001 mds
+437.802 mln.
5.79%
1 janv. 2000
8.052 mds
+51.157 mln.
0.64%
1 janv. 2001
8.287 mds
+235.403 mln.
2.92%
1 janv. 2002
8.178 mds
-108.972 mln.
-1.31%
1 janv. 2003
8.013 mds
-165.068 mln.
-2.02%
1 janv. 2004
8.087 mds
+74.036 mln.
0.92%
1 janv. 2005
8.661 mds
+573.555 mln.
7.09%
1 janv. 2006
9.397 mds
+736.004 mln.
8.5%
1 janv. 2007
10.418 mds
+1.021 mds
10.86%
1 janv. 2008
11.707 mds
+1.289 mds
12.38%
1 janv. 2009
14.34 mds
+2.634 mds
22.5%
1 janv. 2010
16.05 mds
+1.71 mds
11.92%
1 janv. 2011
17.925 mds
+1.874 mds
11.68%
1 janv. 2012
20.274 mds
+2.349 mds
13.11%
1 janv. 2013
23.313 mds
+3.039 mds
14.99%
1 janv. 2014
27.256 mds
+3.942 mds
16.91%
1 janv. 2015
30.344 mds
+3.088 mds
11.33%
1 janv. 2016
32.16 mds
+1.816 mds
5.98%
Classement des pays selon les statistiques actuelles par années


Commentaires: