29
/fr/
fr
AIzaSyAYiBZKx7MnpbEhh9jyipgxe19OcubqV5w
April 1, 2024
177703
Lesotho
LSO
true
2
1
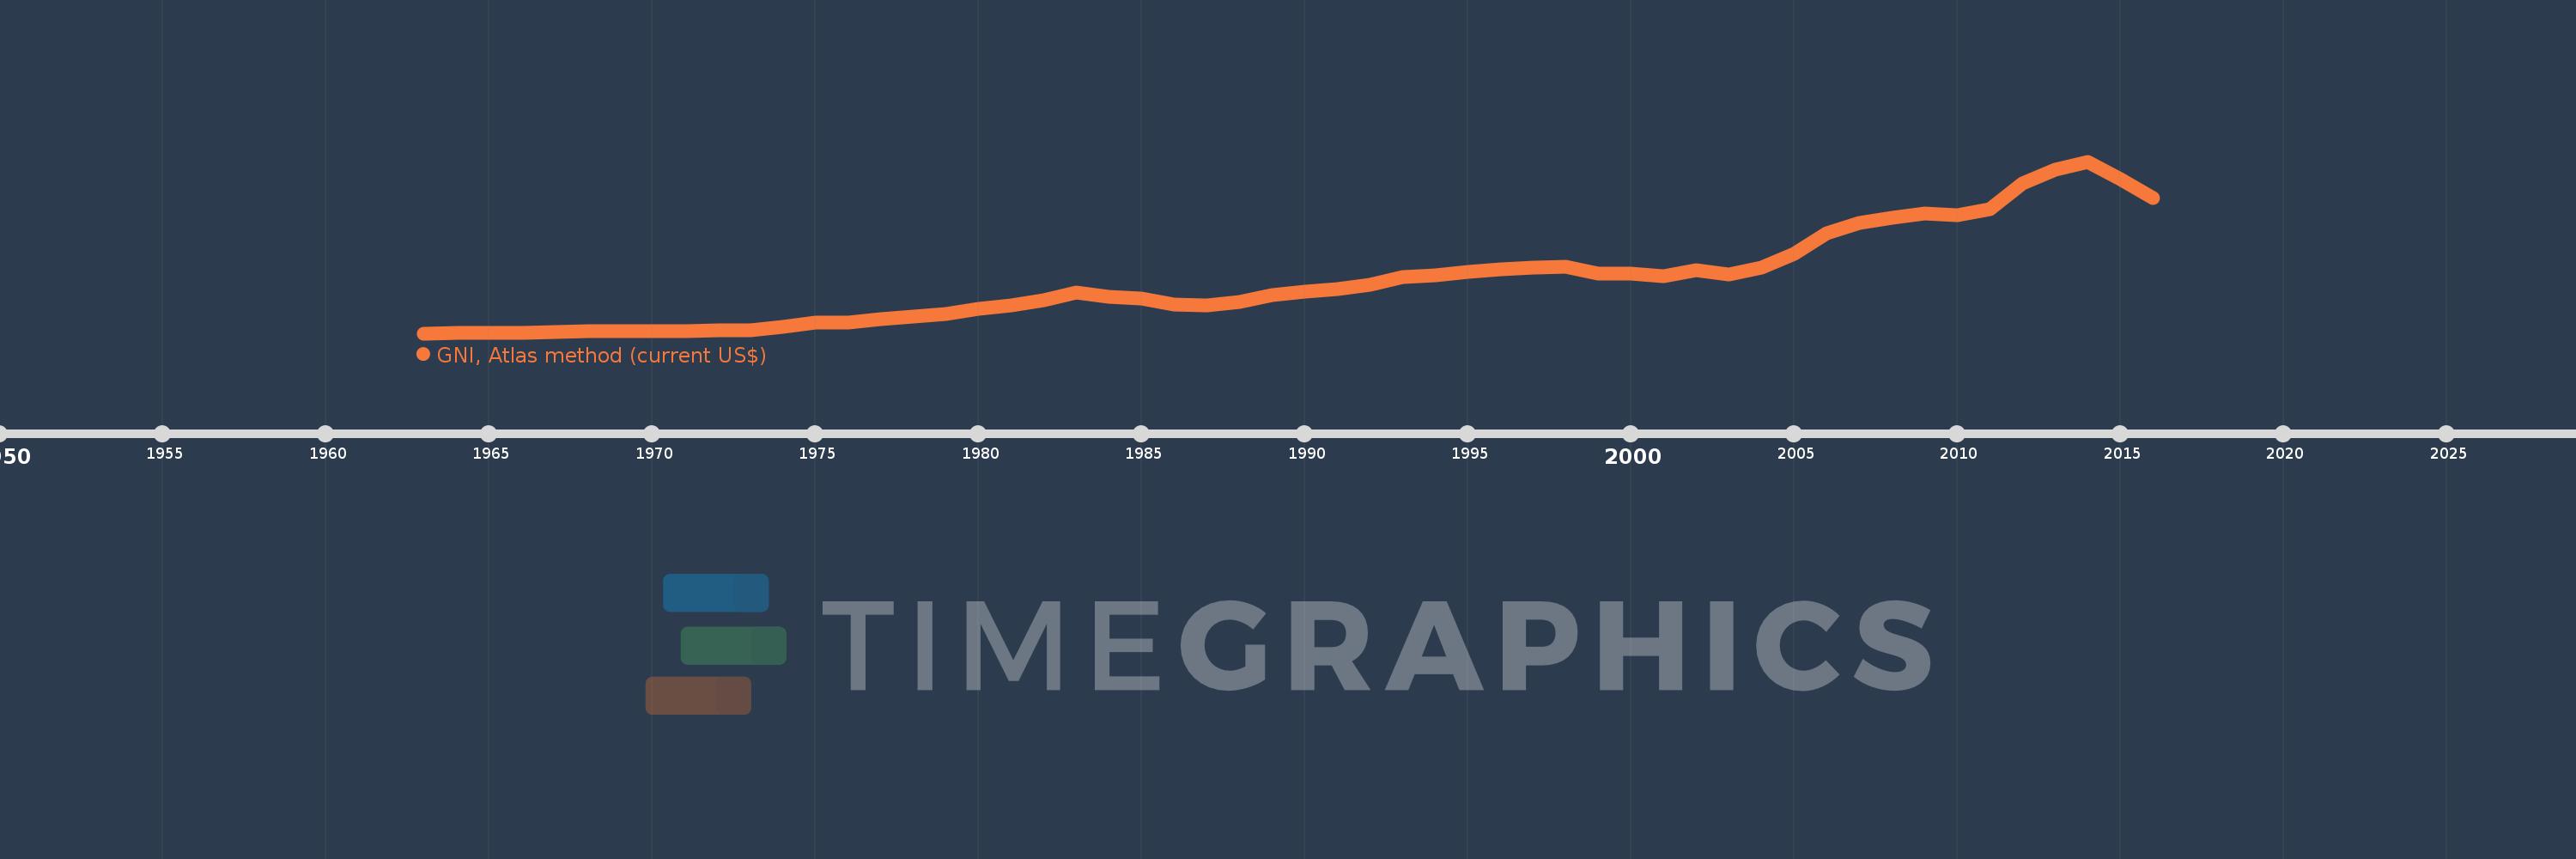
GNI, Atlas method (current US$)
2016,2015,2014,2013,2012,2011,2010,2009,2008,2007,2006,2005,2004,2003,2002,2001,2000,1999,1998,1997,1996,1995,1994,1993,1992,1991,1990,1989,1988,1987,1986,1985,1984,1983,1982,1981,1980,1979,1978,1977,1976,1975,1974,1973,1972,1971,1970,1969,1968,1967,1966,1965,1964,1963
Cette statistique dans les autres pays:
AfghanistanAlbaniaAlgeriaAndorraAngolaAntigua and BarbudaArab WorldArgentinaArmeniaAustraliaAustriaAzerbaijanBahamas, TheBahrainBangladeshBarbadosBelarusBelgiumBelizeBeninBermudaBhutanBoliviaBosnia and HerzegovinaBotswanaBrazilBrunei DarussalamBulgariaBurkina FasoBurundiCabo VerdeCambodiaCameroonCanadaCaribbean small statesCentral African RepublicCentral Europe and the BalticsChadChannel IslandsChileChinaColombiaComorosCongo, Dem. Rep.Congo, Rep.Costa RicaCote d'IvoireCroatiaCubaCyprusCzech RepublicDenmarkDjiboutiDominicaDominican RepublicEarly-demographic dividendEast Asia & PacificEast Asia & Pacific (excluding high income)East Asia & Pacific (IDA & IBRD countries)EcuadorEgypt, Arab Rep.El SalvadorEquatorial GuineaEritreaEstoniaEthiopiaEuro areaEurope & Central AsiaEurope & Central Asia (excluding high income)Europe & Central Asia (IDA & IBRD countries)European UnionFijiFinlandFragile and conflict affected situationsFranceFrench PolynesiaGabonGambia, TheGeorgiaGermanyGhanaGreeceGreenlandGrenadaGuatemalaGuineaGuinea-BissauGuyanaHaitiHeavily indebted poor countries (HIPC)High incomeHondurasHong Kong SAR, ChinaHungaryIBRD onlyIcelandIDA & IBRD totalIDA blendIDA onlyIDA totalIndiaIndonesiaIran, Islamic Rep.IraqIrelandIsle of ManIsraelItalyJamaicaJapanJordanKazakhstanKenyaKiribatiKorea, Rep.KosovoKuwaitKyrgyz RepublicLao PDRLate-demographic dividendLatin America & Caribbean Latin America & Caribbean (excluding high income)Latin America & the Caribbean (IDA & IBRD countries)LatviaLeast developed countries: UN classificationLebanonLesothoLiberiaLibyaLiechtensteinLithuaniaLow & middle incomeLow incomeLower middle incomeLuxembourgMacao SAR, ChinaMacedonia, FYRMadagascarMalawiMalaysiaMaldivesMaliMaltaMarshall IslandsMauritaniaMauritiusMexicoMicronesia, Fed. Sts.Middle East & North AfricaMiddle East & North Africa (excluding high income)Middle East & North Africa (IDA & IBRD countries)Middle incomeMoldovaMonacoMongoliaMontenegroMoroccoMozambiqueMyanmarNamibiaNauruNepalNetherlandsNew CaledoniaNew ZealandNicaraguaNigerNigeriaNorth AmericaNorwayOECD membersOmanOther small statesPacific island small statesPakistanPalauPanamaPapua New GuineaParaguayPeruPhilippinesPolandPortugalPost-demographic dividendPre-demographic dividendPuerto RicoQatarRomaniaRussian FederationRwandaSamoaSan MarinoSao Tome and PrincipeSaudi ArabiaSenegalSerbiaSeychellesSierra LeoneSingaporeSlovak RepublicSloveniaSmall statesSolomon IslandsSouth AfricaSouth AsiaSouth Asia (IDA & IBRD)South SudanSpainSri LankaSt. Kitts and NevisSt. LuciaSt. Vincent and the GrenadinesSub-Saharan Africa Sub-Saharan Africa (excluding high income)Sub-Saharan Africa (IDA & IBRD countries)SudanSurinameSwazilandSwedenSwitzerlandSyrian Arab RepublicTajikistanTanzaniaThailandTimor-LesteTogoTongaTrinidad and TobagoTunisiaTurkeyTurkmenistanTuvaluUgandaUkraineUnited Arab EmiratesUnited KingdomUnited StatesUpper middle incomeUruguayUzbekistanVanuatuVenezuela, RBVietnamVirgin Islands (U.S.)West Bank and GazaWorldYemen, Rep.ZambiaZimbabwe La ligne de temps
Cette échelle de temps montre un graphique de 1963 année à 2016 année Lesotho. Les données jusqu'à 1962 année ne sont pas présentés. Quantité d'observations actuelles selon dates: 54.
Source (désignation):
Les indicateurs du développement mondiale
Source (organisation):
World Bank national accounts data, and OECD National Accounts data files.
Catégories:
Economy & Growth
Dernière mise à jour
23 avr. 2017
Les indicateurs de changement de valeurs selon les années
Minimum:
41.947 mln.
1 janv. 1963
Maximum:
3.464 mds
1 janv. 2014
Pour la date d''observation
Valeur
Changement absolu
Le changement par rapport à la valeur précédente
1 janv. 1963
41.947 mln.
+41.947 mln.
0.0%
1 janv. 1964
47.047 mln.
+5.1 mln.
12.16%
1 janv. 1965
51.807 mln.
+4.759 mln.
10.12%
1 janv. 1966
54.565 mln.
+2.759 mln.
5.32%
1 janv. 1967
71.435 mln.
+16.87 mln.
30.92%
1 janv. 1968
78.53 mln.
+7.095 mln.
9.93%
1 janv. 1969
80.57 mln.
+2.04 mln.
2.6%
1 janv. 1970
83.304 mln.
+2.734 mln.
3.39%
1 janv. 1971
90.172 mln.
+6.868 mln.
8.24%
1 janv. 1972
99.188 mln.
+9.016 mln.
10.0%
1 janv. 1973
109.527 mln.
+10.339 mln.
10.42%
1 janv. 1974
163.095 mln.
+53.568 mln.
48.91%
1 janv. 1975
248.95 mln.
+85.855 mln.
52.64%
1 janv. 1976
263.031 mln.
+14.081 mln.
5.66%
1 janv. 1977
328.588 mln.
+65.556 mln.
24.92%
1 janv. 1978
380.915 mln.
+52.327 mln.
15.92%
1 janv. 1979
426.171 mln.
+45.256 mln.
11.88%
1 janv. 1980
522.447 mln.
+96.277 mln.
22.59%
1 janv. 1981
594.171 mln.
+71.724 mln.
13.73%
1 janv. 1982
704.126 mln.
+109.954 mln.
18.51%
1 janv. 1983
847.203 mln.
+143.078 mln.
20.32%
1 janv. 1984
775.661 mln.
-71.543 mln.
-8.44%
1 janv. 1985
727.728 mln.
-47.933 mln.
-6.18%
1 janv. 1986
617.276 mln.
-110.452 mln.
-15.18%
1 janv. 1987
606.292 mln.
-10.984 mln.
-1.78%
1 janv. 1988
668.761 mln.
+62.469 mln.
10.3%
1 janv. 1989
807.934 mln.
+139.173 mln.
20.81%
1 janv. 1990
868.728 mln.
+60.794 mln.
7.52%
1 janv. 1991
930.245 mln.
+61.517 mln.
7.08%
1 janv. 1992
1.013 mds
+82.934 mln.
8.92%
1 janv. 1993
1.156 mds
+143.046 mln.
14.12%
1 janv. 1994
1.2 mds
+43.705 mln.
3.78%
1 janv. 1995
1.268 mds
+68.145 mln.
5.68%
1 janv. 1996
1.312 mds
+44.242 mln.
3.49%
1 janv. 1997
1.359 mds
+46.862 mln.
3.57%
1 janv. 1998
1.367 mds
+7.718 mln.
0.57%
1 janv. 1999
1.232 mds
-134.545 mln.
-9.84%
1 janv. 2000
1.228 mds
-4.623 mln.
-0.38%
1 janv. 2001
1.187 mds
-41.008 mln.
-3.34%
1 janv. 2002
1.306 mds
+118.813 mln.
10.01%
1 janv. 2003
1.21 mds
-95.441 mln.
-7.31%
1 janv. 2004
1.356 mds
+146.309 mln.
12.09%
1 janv. 2005
1.621 mds
+264.628 mln.
19.51%
1 janv. 2006
2.029 mds
+408.313 mln.
25.19%
1 janv. 2007
2.249 mds
+219.834 mln.
10.83%
1 janv. 2008
2.347 mds
+98.21 mln.
4.37%
1 janv. 2009
2.437 mds
+89.729 mln.
3.82%
1 janv. 2010
2.398 mds
-39.501 mln.
-1.62%
1 janv. 2011
2.517 mds
+118.914 mln.
4.96%
1 janv. 2012
3.032 mds
+515.641 mln.
20.49%
1 janv. 2013
3.303 mds
+271.246 mln.
8.95%
1 janv. 2014
3.464 mds
+160.836 mln.
4.87%
1 janv. 2015
3.11 mds
-353.874 mln.
-10.22%
1 janv. 2016
2.74 mds
-370.791 mln.
-11.92%
Classement des pays selon les statistiques actuelles par années


Commentaires: