29
/fr/
fr
AIzaSyAYiBZKx7MnpbEhh9jyipgxe19OcubqV5w
April 1, 2024
85961
Bhutan
BTN
true
2
1
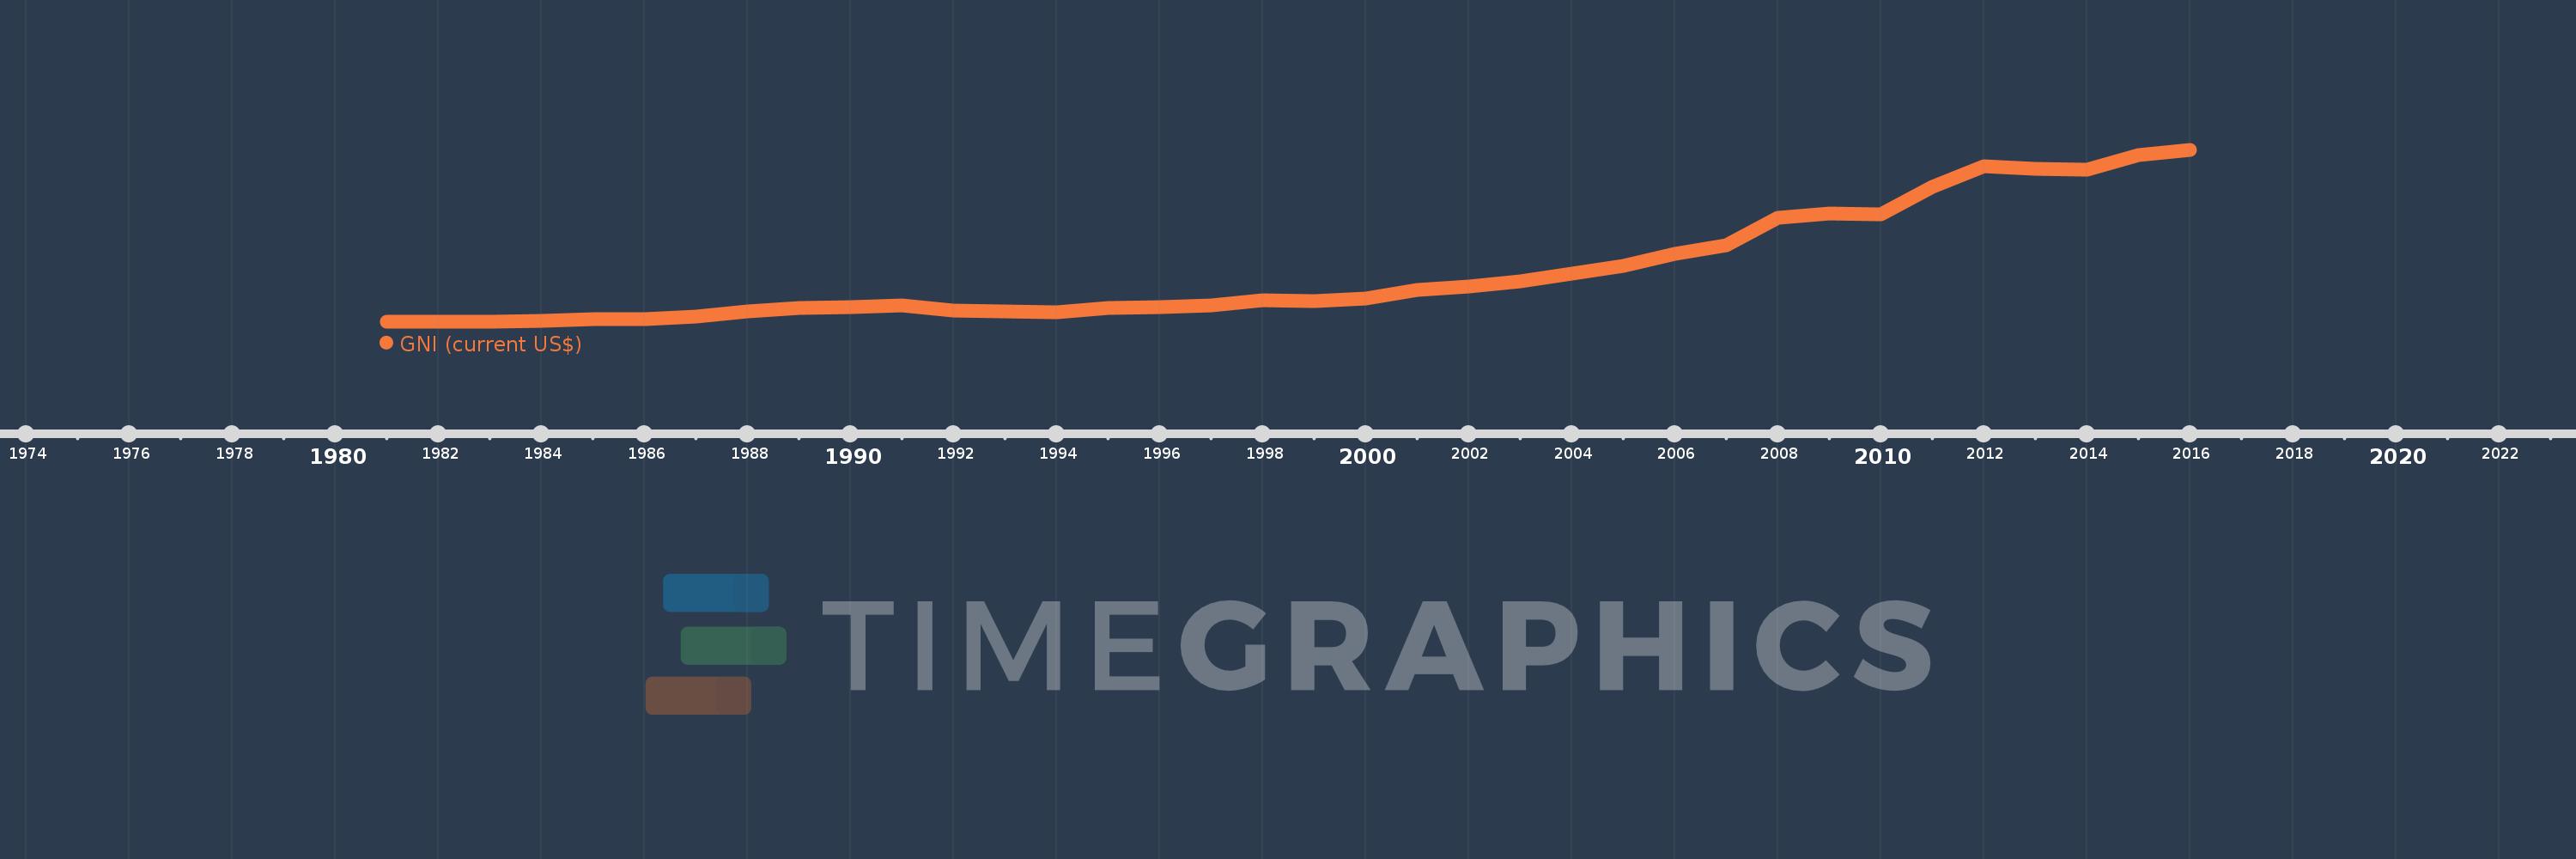
GNI (current US$)
2016,2015,2014,2013,2012,2011,2010,2009,2008,2007,2006,2005,2004,2003,2002,2001,2000,1999,1998,1997,1996,1995,1994,1993,1992,1991,1990,1989,1988,1987,1986,1985,1984,1983,1982,1981
Cette statistique dans les autres pays:
AfghanistanAlbaniaAlgeriaAmerican SamoaAndorraAngolaAntigua and BarbudaArab WorldArgentinaArmeniaAustraliaAustriaAzerbaijanBahamas, TheBahrainBangladeshBarbadosBelarusBelgiumBelizeBeninBermudaBhutanBoliviaBosnia and HerzegovinaBotswanaBrazilBrunei DarussalamBulgariaBurkina FasoBurundiCabo VerdeCambodiaCameroonCanadaCaribbean small statesCentral African RepublicCentral Europe and the BalticsChadChannel IslandsChileChinaColombiaComorosCongo, Dem. Rep.Congo, Rep.Costa RicaCote d'IvoireCroatiaCubaCyprusCzech RepublicDenmarkDjiboutiDominicaDominican RepublicEarly-demographic dividendEast Asia & PacificEast Asia & Pacific (excluding high income)East Asia & Pacific (IDA & IBRD countries)EcuadorEgypt, Arab Rep.El SalvadorEquatorial GuineaEritreaEstoniaEthiopiaEuro areaEurope & Central AsiaEurope & Central Asia (excluding high income)Europe & Central Asia (IDA & IBRD countries)European UnionFaroe IslandsFijiFinlandFragile and conflict affected situationsFranceFrench PolynesiaGabonGambia, TheGeorgiaGermanyGhanaGreeceGreenlandGrenadaGuatemalaGuineaGuinea-BissauGuyanaHaitiHeavily indebted poor countries (HIPC)High incomeHondurasHong Kong SAR, ChinaHungaryIBRD onlyIcelandIDA & IBRD totalIDA blendIDA onlyIDA totalIndiaIndonesiaIran, Islamic Rep.IraqIrelandIsle of ManIsraelItalyJamaicaJapanJordanKazakhstanKenyaKiribatiKorea, Rep.KosovoKuwaitKyrgyz RepublicLao PDRLate-demographic dividendLatin America & Caribbean Latin America & Caribbean (excluding high income)Latin America & the Caribbean (IDA & IBRD countries)LatviaLeast developed countries: UN classificationLebanonLesothoLiberiaLibyaLiechtensteinLithuaniaLow & middle incomeLow incomeLower middle incomeLuxembourgMacao SAR, ChinaMacedonia, FYRMadagascarMalawiMalaysiaMaldivesMaliMaltaMarshall IslandsMauritaniaMauritiusMexicoMicronesia, Fed. Sts.Middle East & North AfricaMiddle East & North Africa (excluding high income)Middle East & North Africa (IDA & IBRD countries)Middle incomeMoldovaMonacoMongoliaMontenegroMoroccoMozambiqueMyanmarNamibiaNauruNepalNetherlandsNew CaledoniaNew ZealandNicaraguaNigerNigeriaNorth AmericaNorwayOECD membersOmanOther small statesPacific island small statesPakistanPalauPanamaPapua New GuineaParaguayPeruPhilippinesPolandPortugalPost-demographic dividendPre-demographic dividendPuerto RicoQatarRomaniaRussian FederationRwandaSamoaSan MarinoSao Tome and PrincipeSaudi ArabiaSenegalSerbiaSeychellesSierra LeoneSingaporeSlovak RepublicSloveniaSmall statesSolomon IslandsSomaliaSouth AfricaSouth AsiaSouth Asia (IDA & IBRD)South SudanSpainSri LankaSt. Kitts and NevisSt. LuciaSt. Vincent and the GrenadinesSub-Saharan Africa Sub-Saharan Africa (excluding high income)Sub-Saharan Africa (IDA & IBRD countries)SudanSurinameSwazilandSwedenSwitzerlandSyrian Arab RepublicTajikistanTanzaniaThailandTimor-LesteTogoTongaTrinidad and TobagoTunisiaTurkeyTurkmenistanTuvaluUgandaUkraineUnited Arab EmiratesUnited KingdomUnited StatesUpper middle incomeUruguayUzbekistanVanuatuVenezuela, RBVietnamVirgin Islands (U.S.)West Bank and GazaWorldYemen, Rep.ZambiaZimbabwe La ligne de temps
Cette échelle de temps montre un graphique de 1981 année à 2016 année Bhutan. Les données jusqu'à 1980 année ne sont pas présentés. Quantité d'observations actuelles selon dates: 36.
Source (désignation):
Les indicateurs du développement mondiale
Source (organisation):
World Bank national accounts data, and OECD National Accounts data files.
Catégories:
Economy & Growth, External Debt
Dernière mise à jour
23 avr. 2017
Les indicateurs de changement de valeurs selon les années
Minimum:
110.208 mln.
1 janv. 1981
Maximum:
1.876 mds
1 janv. 2016
Pour la date d''observation
Valeur
Changement absolu
Le changement par rapport à la valeur précédente
1 janv. 1981
110.208 mln.
+110.208 mln.
0.0%
1 janv. 1982
115.248 mln.
+5.04 mln.
4.57%
1 janv. 1983
114.939 mln.
-309.89 milles
-0.27%
1 janv. 1984
120.428 mln.
+5.489 mln.
4.78%
1 janv. 1985
135.128 mln.
+14.7 mln.
12.21%
1 janv. 1986
137.642 mln.
+2.514 mln.
1.86%
1 janv. 1987
165.499 mln.
+27.858 mln.
20.24%
1 janv. 1988
221.84 mln.
+56.34 mln.
34.04%
1 janv. 1989
257.606 mln.
+35.766 mln.
16.12%
1 janv. 1990
262.875 mln.
+5.27 mln.
2.05%
1 janv. 1991
281.164 mln.
+18.288 mln.
6.96%
1 janv. 1992
228.445 mln.
-52.718 mln.
-18.75%
1 janv. 1993
222.476 mln.
-5.969 mln.
-2.61%
1 janv. 1994
211.156 mln.
-11.32 mln.
-5.09%
1 janv. 1995
250.591 mln.
+39.435 mln.
18.68%
1 janv. 1996
265.813 mln.
+15.222 mln.
6.07%
1 janv. 1997
281.236 mln.
+15.423 mln.
5.8%
1 janv. 1998
334.543 mln.
+53.307 mln.
18.95%
1 janv. 1999
320.649 mln.
-13.895 mln.
-4.15%
1 janv. 2000
347.438 mln.
+26.789 mln.
8.35%
1 janv. 2001
438.662 mln.
+91.224 mln.
26.26%
1 janv. 2002
476.124 mln.
+37.461 mln.
8.54%
1 janv. 2003
529.007 mln.
+52.884 mln.
11.11%
1 janv. 2004
608.231 mln.
+79.224 mln.
14.98%
1 janv. 2005
686.706 mln.
+78.475 mln.
12.9%
1 janv. 2006
807.3 mln.
+120.595 mln.
17.56%
1 janv. 2007
894.176 mln.
+86.876 mln.
10.76%
1 janv. 2008
1.18 mds
+285.959 mln.
31.98%
1 janv. 2009
1.224 mds
+44.179 mln.
3.74%
1 janv. 2010
1.214 mds
-10.128 mln.
-0.83%
1 janv. 2011
1.497 mds
+283.306 mln.
23.33%
1 janv. 2012
1.706 mds
+208.811 mln.
13.94%
1 janv. 2013
1.682 mds
-24.721 mln.
-1.45%
1 janv. 2014
1.675 mds
-6.683 mln.
-0.4%
1 janv. 2015
1.824 mds
+148.931 mln.
8.89%
1 janv. 2016
1.876 mds
+51.742 mln.
2.84%
Classement des pays selon les statistiques actuelles par années


Commentaires: