29
/fr/
fr
AIzaSyAYiBZKx7MnpbEhh9jyipgxe19OcubqV5w
April 1, 2024
239307
Sierra Leone
SLE
true
2
1
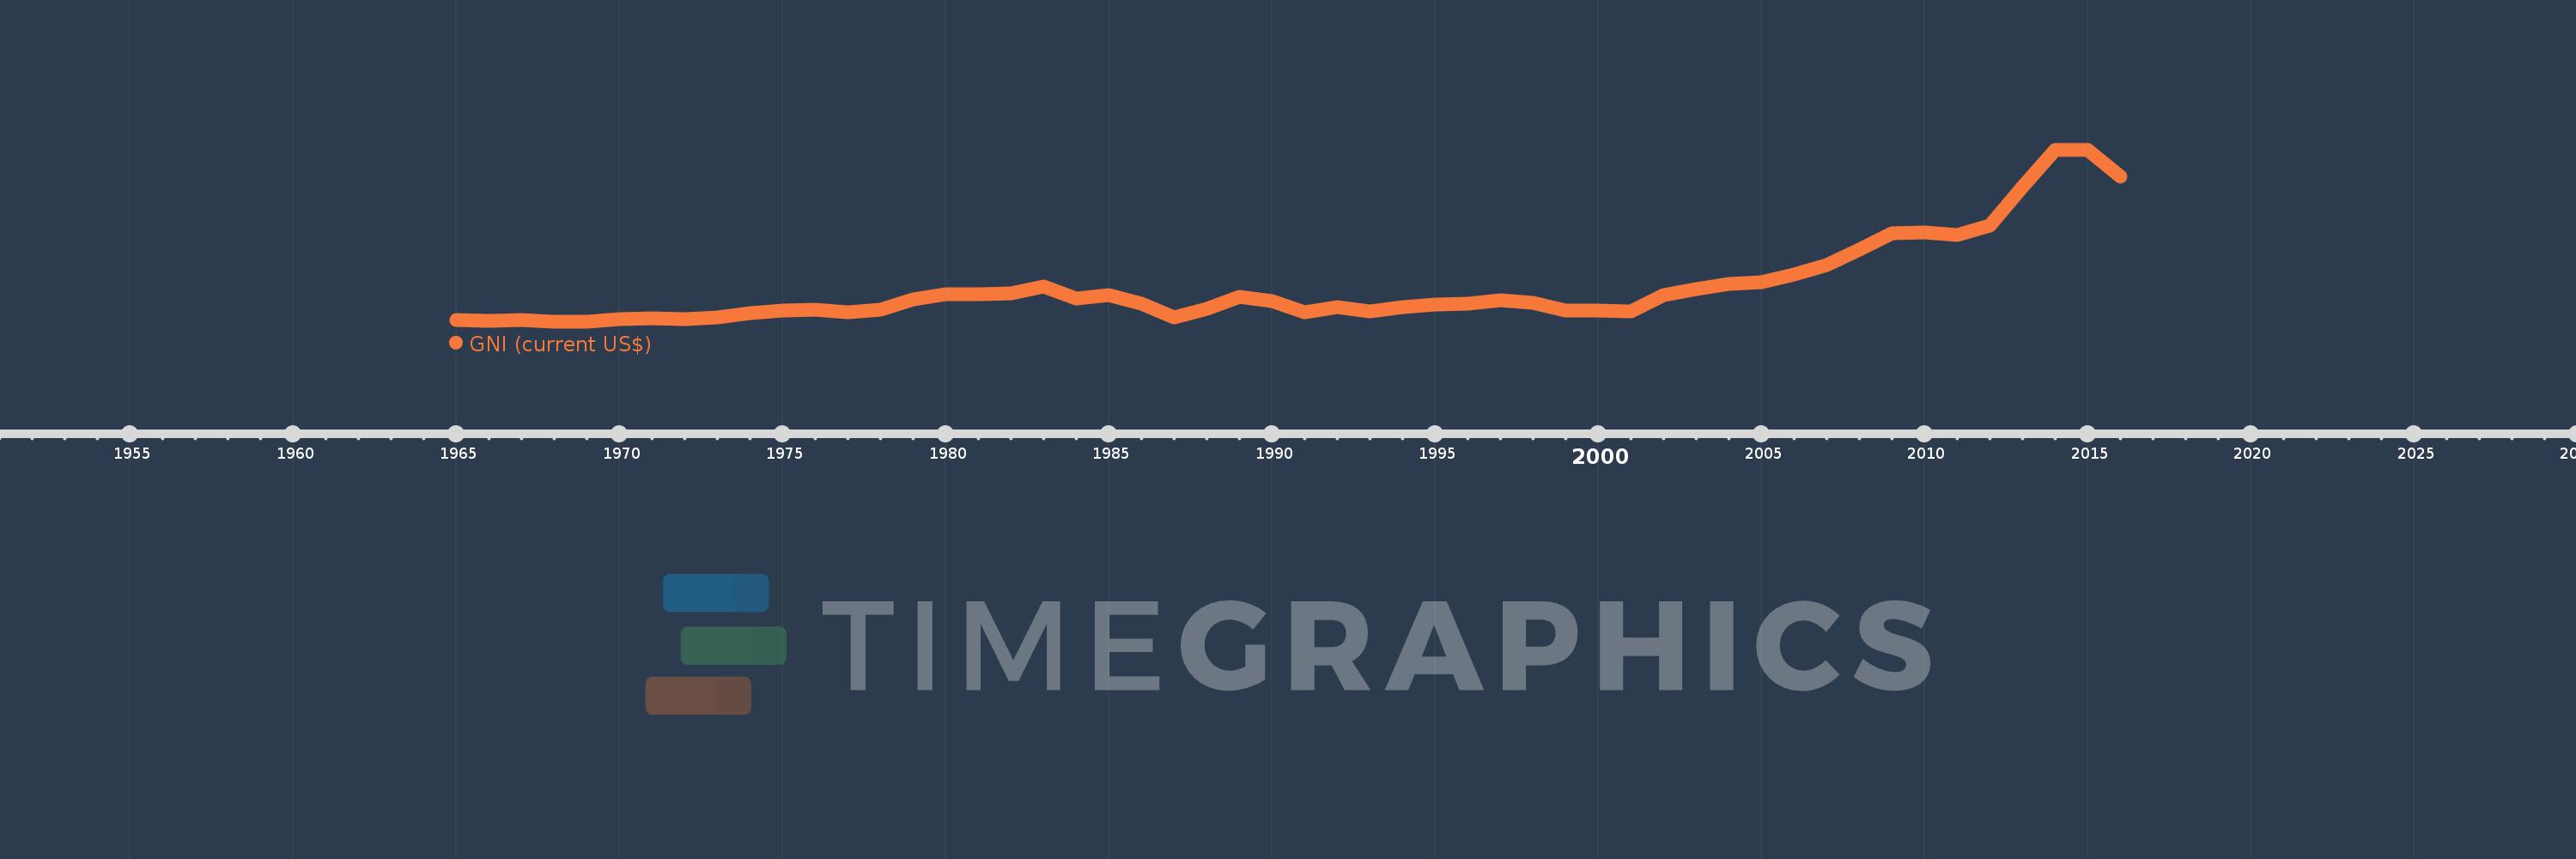
GNI (current US$)
2016,2015,2014,2013,2012,2011,2010,2009,2008,2007,2006,2005,2004,2003,2002,2001,2000,1999,1998,1997,1996,1995,1994,1993,1992,1991,1990,1989,1988,1987,1986,1985,1984,1983,1982,1981,1980,1979,1978,1977,1976,1975,1974,1973,1972,1971,1970,1969,1968,1967,1966,1965
Cette statistique dans les autres pays:
AfghanistanAlbaniaAlgeriaAmerican SamoaAndorraAngolaAntigua and BarbudaArab WorldArgentinaArmeniaAustraliaAustriaAzerbaijanBahamas, TheBahrainBangladeshBarbadosBelarusBelgiumBelizeBeninBermudaBhutanBoliviaBosnia and HerzegovinaBotswanaBrazilBrunei DarussalamBulgariaBurkina FasoBurundiCabo VerdeCambodiaCameroonCanadaCaribbean small statesCentral African RepublicCentral Europe and the BalticsChadChannel IslandsChileChinaColombiaComorosCongo, Dem. Rep.Congo, Rep.Costa RicaCote d'IvoireCroatiaCubaCyprusCzech RepublicDenmarkDjiboutiDominicaDominican RepublicEarly-demographic dividendEast Asia & PacificEast Asia & Pacific (excluding high income)East Asia & Pacific (IDA & IBRD countries)EcuadorEgypt, Arab Rep.El SalvadorEquatorial GuineaEritreaEstoniaEthiopiaEuro areaEurope & Central AsiaEurope & Central Asia (excluding high income)Europe & Central Asia (IDA & IBRD countries)European UnionFaroe IslandsFijiFinlandFragile and conflict affected situationsFranceFrench PolynesiaGabonGambia, TheGeorgiaGermanyGhanaGreeceGreenlandGrenadaGuatemalaGuineaGuinea-BissauGuyanaHaitiHeavily indebted poor countries (HIPC)High incomeHondurasHong Kong SAR, ChinaHungaryIBRD onlyIcelandIDA & IBRD totalIDA blendIDA onlyIDA totalIndiaIndonesiaIran, Islamic Rep.IraqIrelandIsle of ManIsraelItalyJamaicaJapanJordanKazakhstanKenyaKiribatiKorea, Rep.KosovoKuwaitKyrgyz RepublicLao PDRLate-demographic dividendLatin America & Caribbean Latin America & Caribbean (excluding high income)Latin America & the Caribbean (IDA & IBRD countries)LatviaLeast developed countries: UN classificationLebanonLesothoLiberiaLibyaLiechtensteinLithuaniaLow & middle incomeLow incomeLower middle incomeLuxembourgMacao SAR, ChinaMacedonia, FYRMadagascarMalawiMalaysiaMaldivesMaliMaltaMarshall IslandsMauritaniaMauritiusMexicoMicronesia, Fed. Sts.Middle East & North AfricaMiddle East & North Africa (excluding high income)Middle East & North Africa (IDA & IBRD countries)Middle incomeMoldovaMonacoMongoliaMontenegroMoroccoMozambiqueMyanmarNamibiaNauruNepalNetherlandsNew CaledoniaNew ZealandNicaraguaNigerNigeriaNorth AmericaNorwayOECD membersOmanOther small statesPacific island small statesPakistanPalauPanamaPapua New GuineaParaguayPeruPhilippinesPolandPortugalPost-demographic dividendPre-demographic dividendPuerto RicoQatarRomaniaRussian FederationRwandaSamoaSan MarinoSao Tome and PrincipeSaudi ArabiaSenegalSerbiaSeychellesSierra LeoneSingaporeSlovak RepublicSloveniaSmall statesSolomon IslandsSomaliaSouth AfricaSouth AsiaSouth Asia (IDA & IBRD)South SudanSpainSri LankaSt. Kitts and NevisSt. LuciaSt. Vincent and the GrenadinesSub-Saharan Africa Sub-Saharan Africa (excluding high income)Sub-Saharan Africa (IDA & IBRD countries)SudanSurinameSwazilandSwedenSwitzerlandSyrian Arab RepublicTajikistanTanzaniaThailandTimor-LesteTogoTongaTrinidad and TobagoTunisiaTurkeyTurkmenistanTuvaluUgandaUkraineUnited Arab EmiratesUnited KingdomUnited StatesUpper middle incomeUruguayUzbekistanVanuatuVenezuela, RBVietnamVirgin Islands (U.S.)West Bank and GazaWorldYemen, Rep.ZambiaZimbabwe La ligne de temps
Cette échelle de temps montre un graphique de 1965 année à 2016 année Sierra Leone. Les données jusqu'à 1964 année ne sont pas présentés. Quantité d'observations actuelles selon dates: 52.
Source (désignation):
Les indicateurs du développement mondiale
Source (organisation):
World Bank national accounts data, and OECD National Accounts data files.
Catégories:
Economy & Growth, External Debt
Dernière mise à jour
23 avr. 2017
Les indicateurs de changement de valeurs selon les années
Minimum:
332.11 mln.
1 janv. 1969
Maximum:
4.896 mds
1 janv. 2015
Pour la date d''observation
Valeur
Changement absolu
Le changement par rapport à la valeur précédente
1 janv. 1965
373.412 mln.
+373.412 mln.
0.0%
1 janv. 1966
360.465 mln.
-12.947 mln.
-3.47%
1 janv. 1967
376.607 mln.
+16.142 mln.
4.48%
1 janv. 1968
350.045 mln.
-26.561 mln.
-7.05%
1 janv. 1969
332.11 mln.
-17.935 mln.
-5.12%
1 janv. 1970
411.79 mln.
+79.68 mln.
23.99%
1 janv. 1971
425.645 mln.
+13.855 mln.
3.36%
1 janv. 1972
410.617 mln.
-15.028 mln.
-3.53%
1 janv. 1973
457.443 mln.
+46.826 mln.
11.4%
1 janv. 1974
564.776 mln.
+107.333 mln.
23.46%
1 janv. 1975
635.301 mln.
+70.525 mln.
12.49%
1 janv. 1976
666.269 mln.
+30.968 mln.
4.87%
1 janv. 1977
580.212 mln.
-86.058 mln.
-12.92%
1 janv. 1978
668.004 mln.
+87.793 mln.
15.13%
1 janv. 1979
923.528 mln.
+255.524 mln.
38.25%
1 janv. 1980
1.08 mds
+156.496 mln.
16.95%
1 janv. 1981
1.071 mds
-9.418 mln.
-0.87%
1 janv. 1982
1.087 mds
+16.018 mln.
1.5%
1 janv. 1983
1.272 mds
+184.929 mln.
17.02%
1 janv. 1984
963.374 mln.
-308.179 mln.
-24.24%
1 janv. 1985
1.058 mds
+94.311 mln.
9.79%
1 janv. 1986
828.277 mln.
-229.408 mln.
-21.69%
1 janv. 1987
450.595 mln.
-377.682 mln.
-45.6%
1 janv. 1988
670.299 mln.
+219.704 mln.
48.76%
1 janv. 1989
998.084 mln.
+327.785 mln.
48.9%
1 janv. 1990
884.574 mln.
-113.51 mln.
-11.37%
1 janv. 1991
579.841 mln.
-304.734 mln.
-34.45%
1 janv. 1992
719.59 mln.
+139.75 mln.
24.1%
1 janv. 1993
605.308 mln.
-114.282 mln.
-15.88%
1 janv. 1994
724.812 mln.
+119.504 mln.
19.74%
1 janv. 1995
798.476 mln.
+73.664 mln.
10.16%
1 janv. 1996
818.479 mln.
+20.003 mln.
2.51%
1 janv. 1997
909.238 mln.
+90.759 mln.
11.09%
1 janv. 1998
832.919 mln.
-76.319 mln.
-8.39%
1 janv. 1999
637.318 mln.
-195.601 mln.
-23.48%
1 janv. 2000
644.97 mln.
+7.652 mln.
1.2%
1 janv. 2001
616.099 mln.
-28.871 mln.
-4.48%
1 janv. 2002
1.052 mds
+436.211 mln.
70.8%
1 janv. 2003
1.209 mds
+156.66 mln.
14.89%
1 janv. 2004
1.344 mds
+135.483 mln.
11.21%
1 janv. 2005
1.399 mds
+54.656 mln.
4.07%
1 janv. 2006
1.59 mds
+190.746 mln.
13.63%
1 janv. 2007
1.848 mds
+257.914 mln.
16.22%
1 janv. 2008
2.264 mds
+416.713 mln.
22.55%
1 janv. 2009
2.701 mds
+436.279 mln.
19.27%
1 janv. 2010
2.701 mds
+295.041 milles
0.01%
1 janv. 2011
2.645 mds
-56.006 mln.
-2.07%
1 janv. 2012
2.901 mds
+256.354 mln.
9.69%
1 janv. 2013
3.924 mds
+1.023 mds
35.25%
1 janv. 2014
4.893 mds
+969.404 mln.
24.7%
1 janv. 2015
4.896 mds
+2.711 mln.
0.06%
1 janv. 2016
4.191 mds
-704.961 mln.
-14.4%
Classement des pays selon les statistiques actuelles par années


Commentaires: