29
/fr/
fr
AIzaSyAYiBZKx7MnpbEhh9jyipgxe19OcubqV5w
April 1, 2024
79759
Barbados
BRB
true
2
1
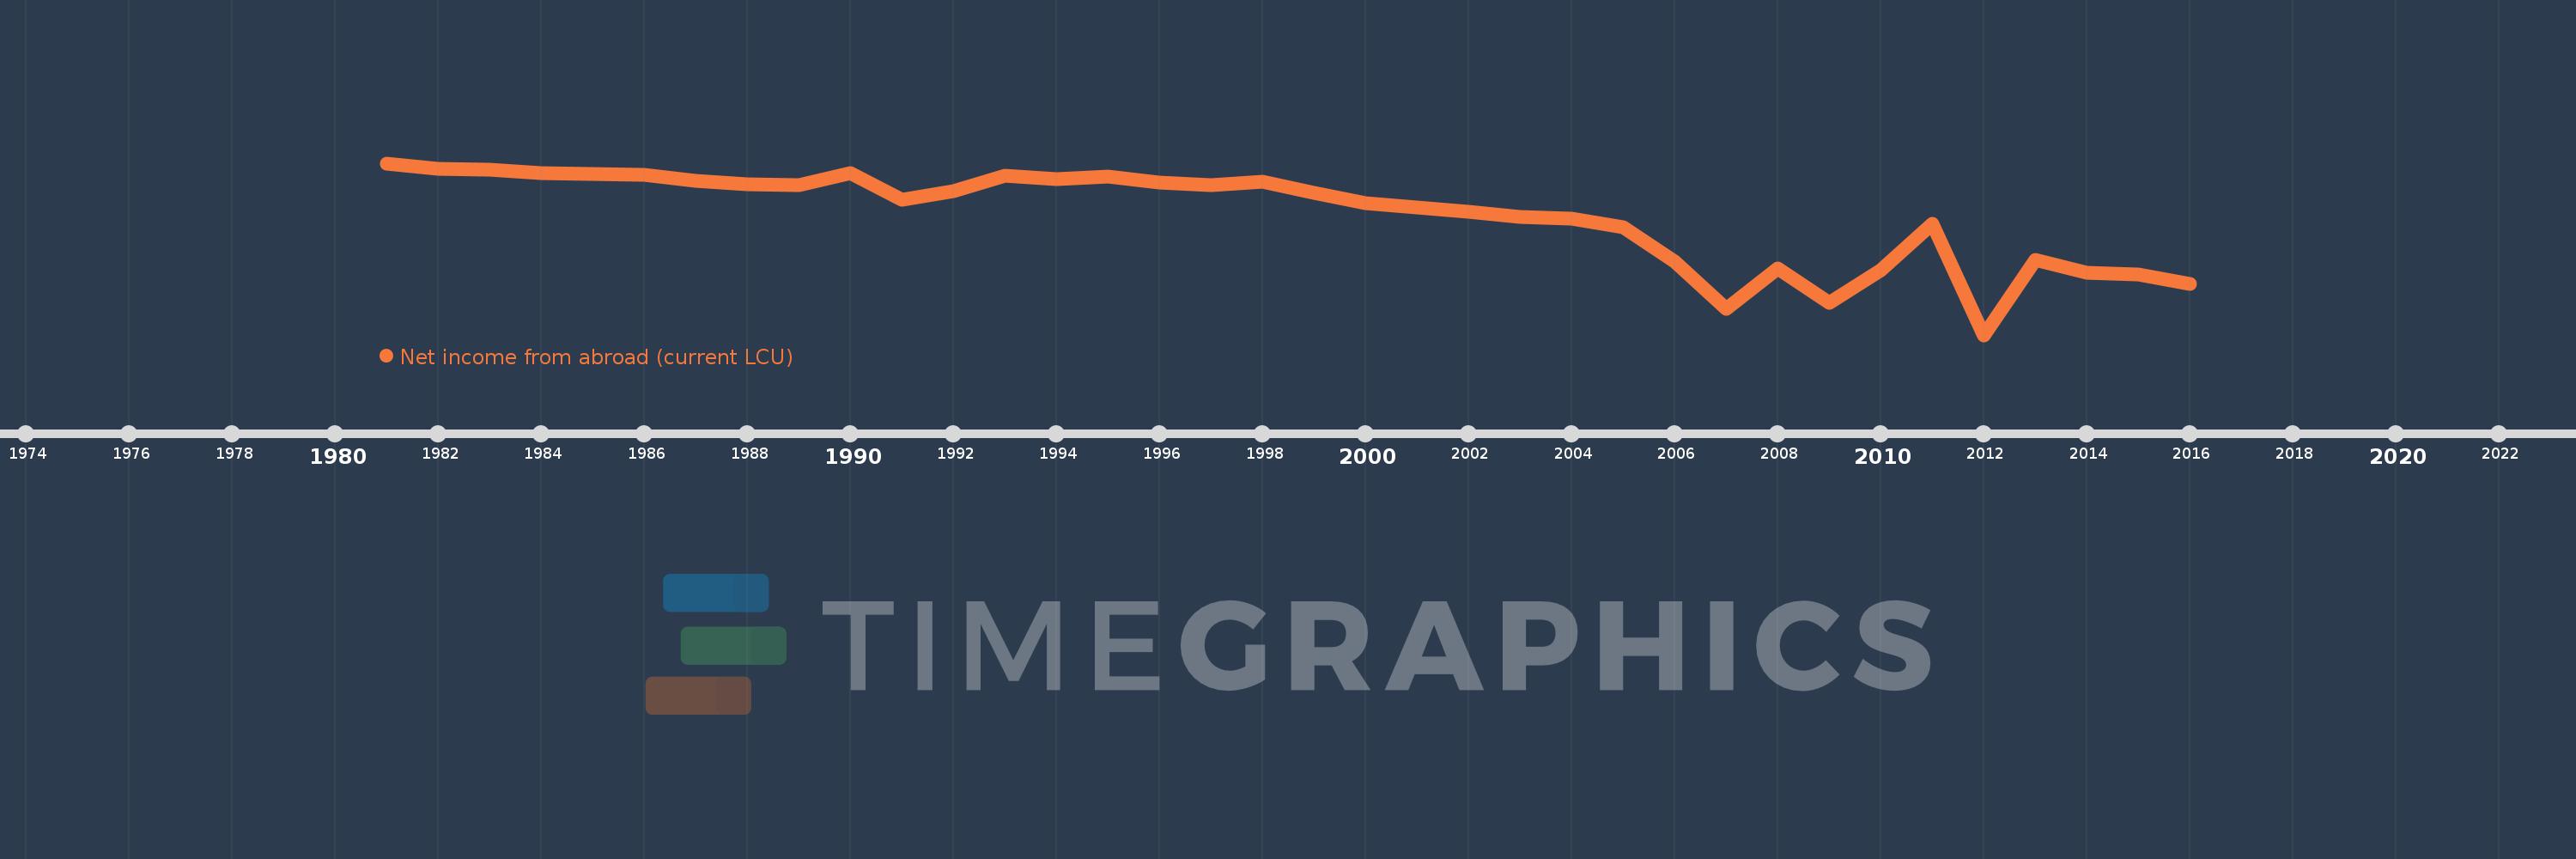
Net income from abroad (current LCU)
2016,2015,2014,2013,2012,2011,2010,2009,2008,2007,2006,2005,2004,2003,2002,2001,2000,1999,1998,1997,1996,1995,1994,1993,1992,1991,1990,1989,1988,1987,1986,1985,1984,1983,1982,1981
Cette statistique dans les autres pays:
AfghanistanAlbaniaAlgeriaAndorraAngolaAntigua and BarbudaArgentinaArmeniaAustraliaAustriaAzerbaijanBahamas, TheBahrainBangladeshBarbadosBelarusBelgiumBelizeBeninBermudaBhutanBoliviaBosnia and HerzegovinaBotswanaBrazilBrunei DarussalamBulgariaBurkina FasoBurundiCabo VerdeCambodiaCameroonCanadaCentral African RepublicChadChannel IslandsChileChinaColombiaComorosCongo, Dem. Rep.Congo, Rep.Costa RicaCote d'IvoireCroatiaCubaCyprusCzech RepublicDenmarkDjiboutiDominicaDominican RepublicEcuadorEgypt, Arab Rep.El SalvadorEquatorial GuineaEritreaEstoniaEthiopiaFaroe IslandsFijiFinlandFranceFrench PolynesiaGabonGambia, TheGeorgiaGermanyGhanaGreeceGreenlandGrenadaGuatemalaGuineaGuinea-BissauGuyanaHaitiHondurasHong Kong SAR, ChinaHungaryIcelandIndiaIndonesiaIran, Islamic Rep.IraqIrelandIsraelItalyJamaicaJapanJordanKazakhstanKenyaKiribatiKorea, Rep.KosovoKuwaitKyrgyz RepublicLao PDRLatviaLebanonLesothoLiberiaLibyaLithuaniaLuxembourgMacao SAR, ChinaMacedonia, FYRMadagascarMalawiMalaysiaMaldivesMaliMaltaMarshall IslandsMauritaniaMauritiusMexicoMicronesia, Fed. Sts.MoldovaMonacoMongoliaMontenegroMoroccoMozambiqueMyanmarNamibiaNepalNetherlandsNew CaledoniaNew ZealandNicaraguaNigerNigeriaNorwayOmanPakistanPalauPanamaPapua New GuineaParaguayPeruPhilippinesPolandPortugalPuerto RicoQatarRomaniaRussian FederationRwandaSamoaSao Tome and PrincipeSaudi ArabiaSenegalSerbiaSeychellesSierra LeoneSingaporeSlovak RepublicSloveniaSolomon IslandsSomaliaSouth AfricaSouth SudanSpainSri LankaSt. Kitts and NevisSt. LuciaSt. Vincent and the GrenadinesSudanSurinameSwazilandSwedenSwitzerlandSyrian Arab RepublicTajikistanTanzaniaThailandTimor-LesteTogoTongaTrinidad and TobagoTunisiaTurkeyTurkmenistanTuvaluUgandaUkraineUnited Arab EmiratesUnited KingdomUnited StatesUruguayUzbekistanVanuatuVenezuela, RBVietnamVirgin Islands (U.S.)West Bank and GazaYemen, Rep.ZambiaZimbabwe La ligne de temps
Cette échelle de temps montre un graphique de 1981 année à 2016 année Barbados. Les données jusqu'à 1980 année ne sont pas présentés. Quantité d'observations actuelles selon dates: 36.
Source (désignation):
Les indicateurs du développement mondiale
Source (organisation):
World Bank national accounts data, and OECD National Accounts data files.
Catégories:
Economy & Growth
Dernière mise à jour
23 avr. 2017
Les indicateurs de changement de valeurs selon les années
Minimum:
-600.293 mln.
1 janv. 2012
Maximum:
-17.096 mln.
1 janv. 1981
Pour la date d''observation
Valeur
Changement absolu
Le changement par rapport à la valeur précédente
1 janv. 1981
-17.096 mln.
-17.096 mln.
0.0%
1 janv. 1982
-36.002 mln.
-18.906 mln.
110.59%
1 janv. 1983
-38.215 mln.
-2.212 mln.
6.15%
1 janv. 1984
-51.892 mln.
-13.677 mln.
35.79%
1 janv. 1985
-54.506 mln.
-2.614 mln.
5.04%
1 janv. 1986
-55.512 mln.
-1.006 mln.
1.85%
1 janv. 1987
-77.636 mln.
-22.124 mln.
39.86%
1 janv. 1988
-89.704 mln.
-12.067 mln.
15.54%
1 janv. 1989
-90.307 mln.
-603.352 milles
0.67%
1 janv. 1990
-51.892 mln.
+38.416 mln.
-42.54%
1 janv. 1991
-140.188 mln.
-88.296 mln.
170.16%
1 janv. 1992
-112.952 mln.
+27.236 mln.
-19.43%
1 janv. 1993
-58.106 mln.
+54.846 mln.
-48.56%
1 janv. 1994
-71.021 mln.
-12.915 mln.
22.23%
1 janv. 1995
-63.356 mln.
+7.665 mln.
-10.79%
1 janv. 1996
-81.357 mln.
-18.001 mln.
28.41%
1 janv. 1997
-91.715 mln.
-10.358 mln.
12.73%
1 janv. 1998
-81.055 mln.
+10.66 mln.
-11.62%
1 janv. 1999
-118.063 mln.
-37.008 mln.
45.66%
1 janv. 2000
-153.261 mln.
-35.198 mln.
29.81%
1 janv. 2001
-167.6 mln.
-14.339 mln.
9.36%
1 janv. 2002
-183.3 mln.
-15.7 mln.
9.37%
1 janv. 2003
-198.0 mln.
-14.7 mln.
8.02%
1 janv. 2004
-205.5 mln.
-7.5 mln.
3.79%
1 janv. 2005
-233.71 mln.
-28.21 mln.
13.73%
1 janv. 2006
-350.0 mln.
-116.29 mln.
49.76%
1 janv. 2007
-512.801 mln.
-162.801 mln.
46.51%
1 janv. 2008
-375.634 mln.
+137.167 mln.
-26.75%
1 janv. 2009
-491.904 mln.
-116.27 mln.
30.95%
1 janv. 2010
-380.103 mln.
+111.801 mln.
-22.73%
1 janv. 2011
-223.899 mln.
+156.204 mln.
-41.1%
1 janv. 2012
-600.293 mln.
-376.393 mln.
168.11%
1 janv. 2013
-344.807 mln.
+255.486 mln.
-42.56%
1 janv. 2014
-389.199 mln.
-44.392 mln.
12.87%
1 janv. 2015
-394.883 mln.
-5.684 mln.
1.46%
1 janv. 2016
-425.885 mln.
-31.002 mln.
7.85%
Classement des pays selon les statistiques actuelles par années


Commentaires: