29
/fr/
fr
AIzaSyAYiBZKx7MnpbEhh9jyipgxe19OcubqV5w
April 1, 2024
205600
Namibia
NAM
true
2
1
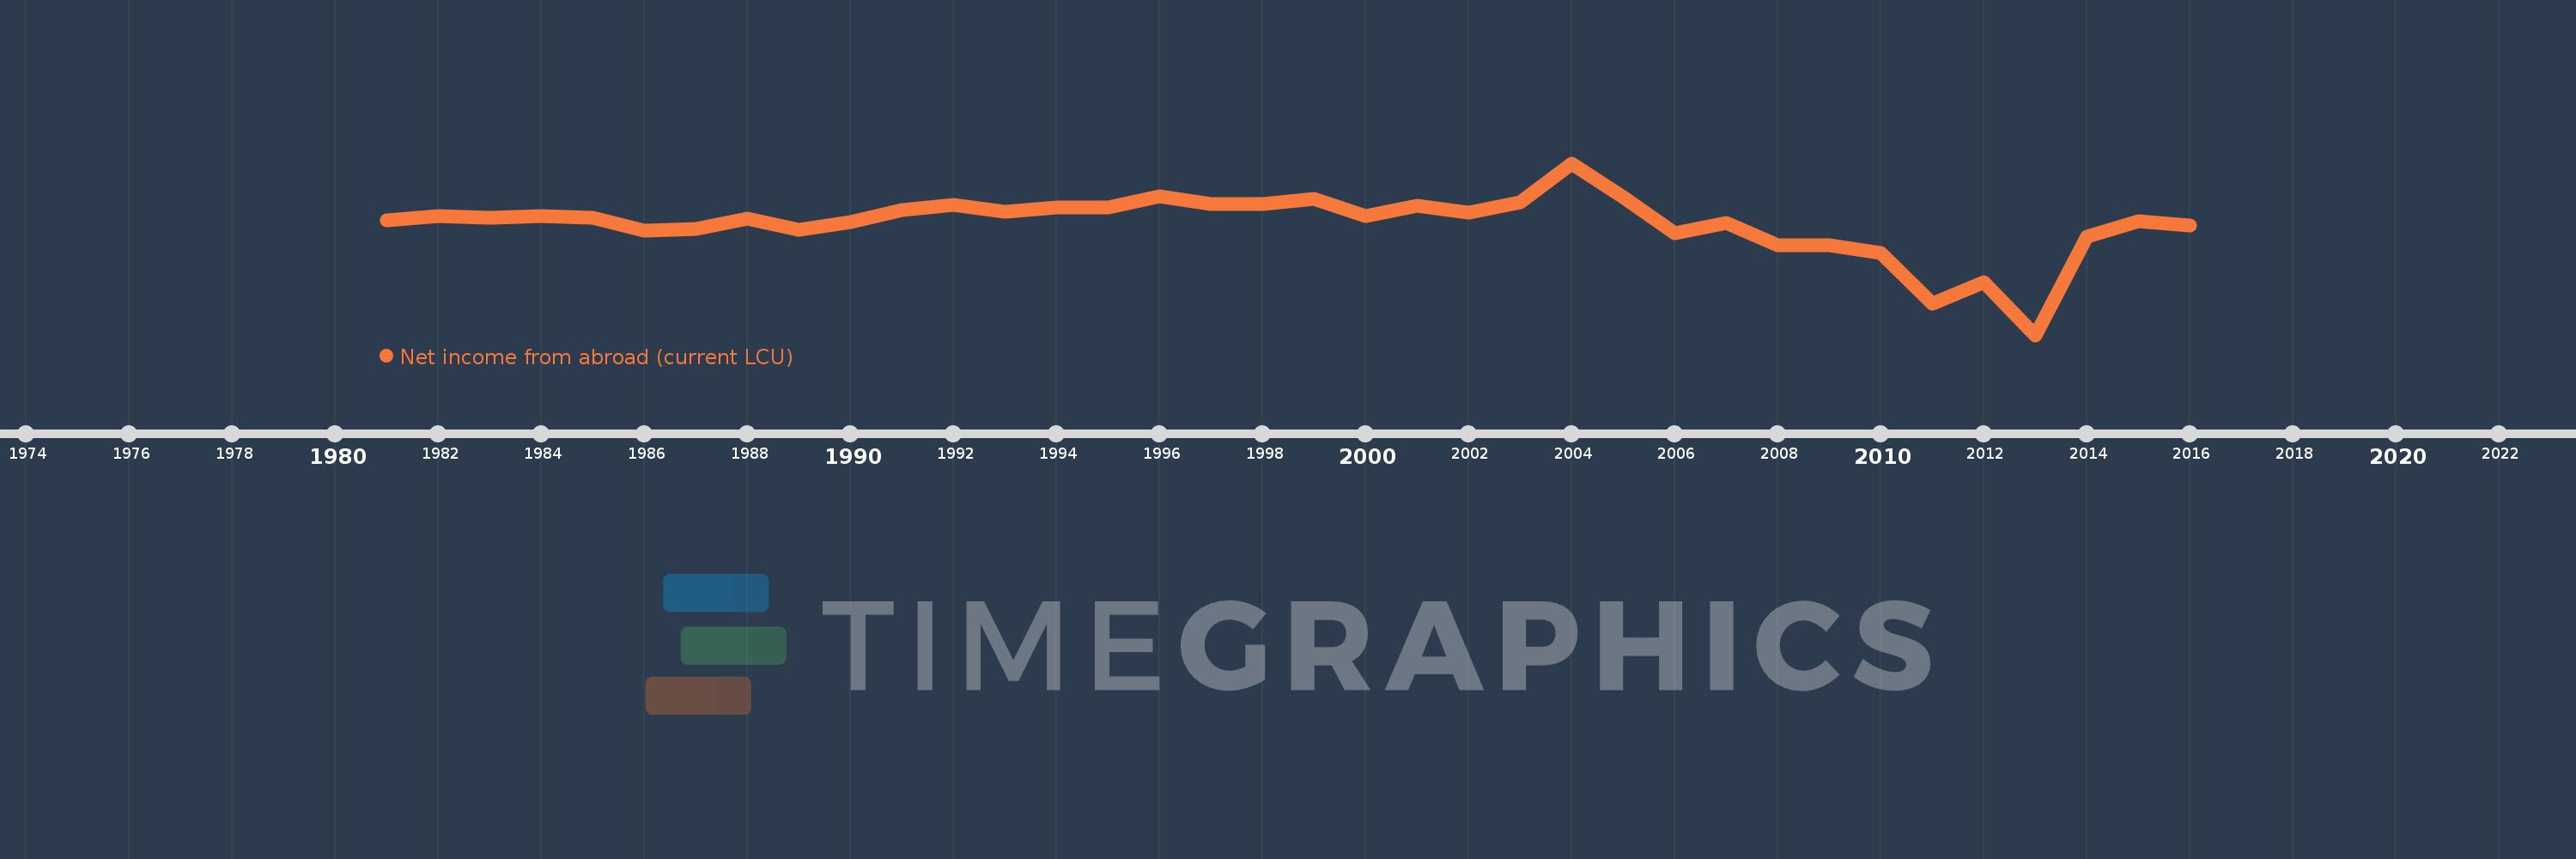
Net income from abroad (current LCU)
2016,2015,2014,2013,2012,2011,2010,2009,2008,2007,2006,2005,2004,2003,2002,2001,2000,1999,1998,1997,1996,1995,1994,1993,1992,1991,1990,1989,1988,1987,1986,1985,1984,1983,1982,1981
Cette statistique dans les autres pays:
AfghanistanAlbaniaAlgeriaAndorraAngolaAntigua and BarbudaArgentinaArmeniaAustraliaAustriaAzerbaijanBahamas, TheBahrainBangladeshBarbadosBelarusBelgiumBelizeBeninBermudaBhutanBoliviaBosnia and HerzegovinaBotswanaBrazilBrunei DarussalamBulgariaBurkina FasoBurundiCabo VerdeCambodiaCameroonCanadaCentral African RepublicChadChannel IslandsChileChinaColombiaComorosCongo, Dem. Rep.Congo, Rep.Costa RicaCote d'IvoireCroatiaCubaCyprusCzech RepublicDenmarkDjiboutiDominicaDominican RepublicEcuadorEgypt, Arab Rep.El SalvadorEquatorial GuineaEritreaEstoniaEthiopiaFaroe IslandsFijiFinlandFranceFrench PolynesiaGabonGambia, TheGeorgiaGermanyGhanaGreeceGreenlandGrenadaGuatemalaGuineaGuinea-BissauGuyanaHaitiHondurasHong Kong SAR, ChinaHungaryIcelandIndiaIndonesiaIran, Islamic Rep.IraqIrelandIsraelItalyJamaicaJapanJordanKazakhstanKenyaKiribatiKorea, Rep.KosovoKuwaitKyrgyz RepublicLao PDRLatviaLebanonLesothoLiberiaLibyaLithuaniaLuxembourgMacao SAR, ChinaMacedonia, FYRMadagascarMalawiMalaysiaMaldivesMaliMaltaMarshall IslandsMauritaniaMauritiusMexicoMicronesia, Fed. Sts.MoldovaMonacoMongoliaMontenegroMoroccoMozambiqueMyanmarNamibiaNepalNetherlandsNew CaledoniaNew ZealandNicaraguaNigerNigeriaNorwayOmanPakistanPalauPanamaPapua New GuineaParaguayPeruPhilippinesPolandPortugalPuerto RicoQatarRomaniaRussian FederationRwandaSamoaSao Tome and PrincipeSaudi ArabiaSenegalSerbiaSeychellesSierra LeoneSingaporeSlovak RepublicSloveniaSolomon IslandsSomaliaSouth AfricaSouth SudanSpainSri LankaSt. Kitts and NevisSt. LuciaSt. Vincent and the GrenadinesSudanSurinameSwazilandSwedenSwitzerlandSyrian Arab RepublicTajikistanTanzaniaThailandTimor-LesteTogoTongaTrinidad and TobagoTunisiaTurkeyTurkmenistanTuvaluUgandaUkraineUnited Arab EmiratesUnited KingdomUnited StatesUruguayUzbekistanVanuatuVenezuela, RBVietnamVirgin Islands (U.S.)West Bank and GazaYemen, Rep.ZambiaZimbabwe La ligne de temps
Cette échelle de temps montre un graphique de 1981 année à 2016 année Namibia. Les données jusqu'à 1980 année ne sont pas présentés. Quantité d'observations actuelles selon dates: 36.
Source (désignation):
Les indicateurs du développement mondiale
Source (organisation):
World Bank national accounts data, and OECD National Accounts data files.
Catégories:
Economy & Growth
Dernière mise à jour
23 avr. 2017
Les indicateurs de changement de valeurs selon les années
Minimum:
-4.279 mds
1 janv. 2013
Maximum:
1.732 mds
1 janv. 2004
Pour la date d''observation
Valeur
Changement absolu
Le changement par rapport à la valeur précédente
1 janv. 1981
-273.0 mln.
-273.0 mln.
0.0%
1 janv. 1982
-109.0 mln.
+164.0 mln.
-60.07%
1 janv. 1983
-170.0 mln.
-61.0 mln.
55.96%
1 janv. 1984
-106.0 mln.
+64.0 mln.
-37.65%
1 janv. 1985
-180.0 mln.
-74.0 mln.
69.81%
1 janv. 1986
-629.0 mln.
-449.0 mln.
249.44%
1 janv. 1987
-562.0 mln.
+67.0 mln.
-10.65%
1 janv. 1988
-217.0 mln.
+345.0 mln.
-61.39%
1 janv. 1989
-595.0 mln.
-378.0 mln.
174.19%
1 janv. 1990
-341.0 mln.
+254.0 mln.
-42.69%
1 janv. 1991
97.025 mln.
+438.024 mln.
-128.45%
1 janv. 1992
267.0 mln.
+169.976 mln.
175.19%
1 janv. 1993
48.0 mln.
-219.0 mln.
-82.02%
1 janv. 1994
183.0 mln.
+135.0 mln.
281.25%
1 janv. 1995
182.0 mln.
-1000.0 milles
-0.55%
1 janv. 1996
569.0 mln.
+387.0 mln.
212.64%
1 janv. 1997
310.0 mln.
-259.0 mln.
-45.52%
1 janv. 1998
306.0 mln.
-4.0 mln.
-1.29%
1 janv. 1999
484.0 mln.
+178.0 mln.
58.17%
1 janv. 2000
-106.0 mln.
-590.0 mln.
-121.9%
1 janv. 2001
230.5 mln.
+336.5 mln.
-317.45%
1 janv. 2002
-9.7 mln.
-240.2 mln.
-104.21%
1 janv. 2003
356.12 mln.
+365.82 mln.
-3.77 milles%
1 janv. 2004
1.732 mds
+1.376 mds
386.27%
1 janv. 2005
538.824 mln.
-1.193 mds
-68.89%
1 janv. 2006
-715.0 mln.
-1.254 mds
-232.7%
1 janv. 2007
-351.0 mln.
+364.0 mln.
-50.91%
1 janv. 2008
-1.144 mds
-792.96 mln.
225.91%
1 janv. 2009
-1.144 mds
-444.0 milles
0.04%
1 janv. 2010
-1.418 mds
-273.838 mln.
23.93%
1 janv. 2011
-3.169 mds
-1.75 mds
123.42%
1 janv. 2012
-2.429 mds
+739.887 mln.
-23.35%
1 janv. 2013
-4.279 mds
-1.85 mds
76.18%
1 janv. 2014
-829.582 mln.
+3.449 mds
-80.61%
1 janv. 2015
-287.75 mln.
+541.832 mln.
-65.31%
1 janv. 2016
-458.593 mln.
-170.843 mln.
59.37%
Classement des pays selon les statistiques actuelles par années


Commentaires: