29
/fr/
fr
AIzaSyAYiBZKx7MnpbEhh9jyipgxe19OcubqV5w
April 1, 2024
79588
Barbados
BRB
true
2
1
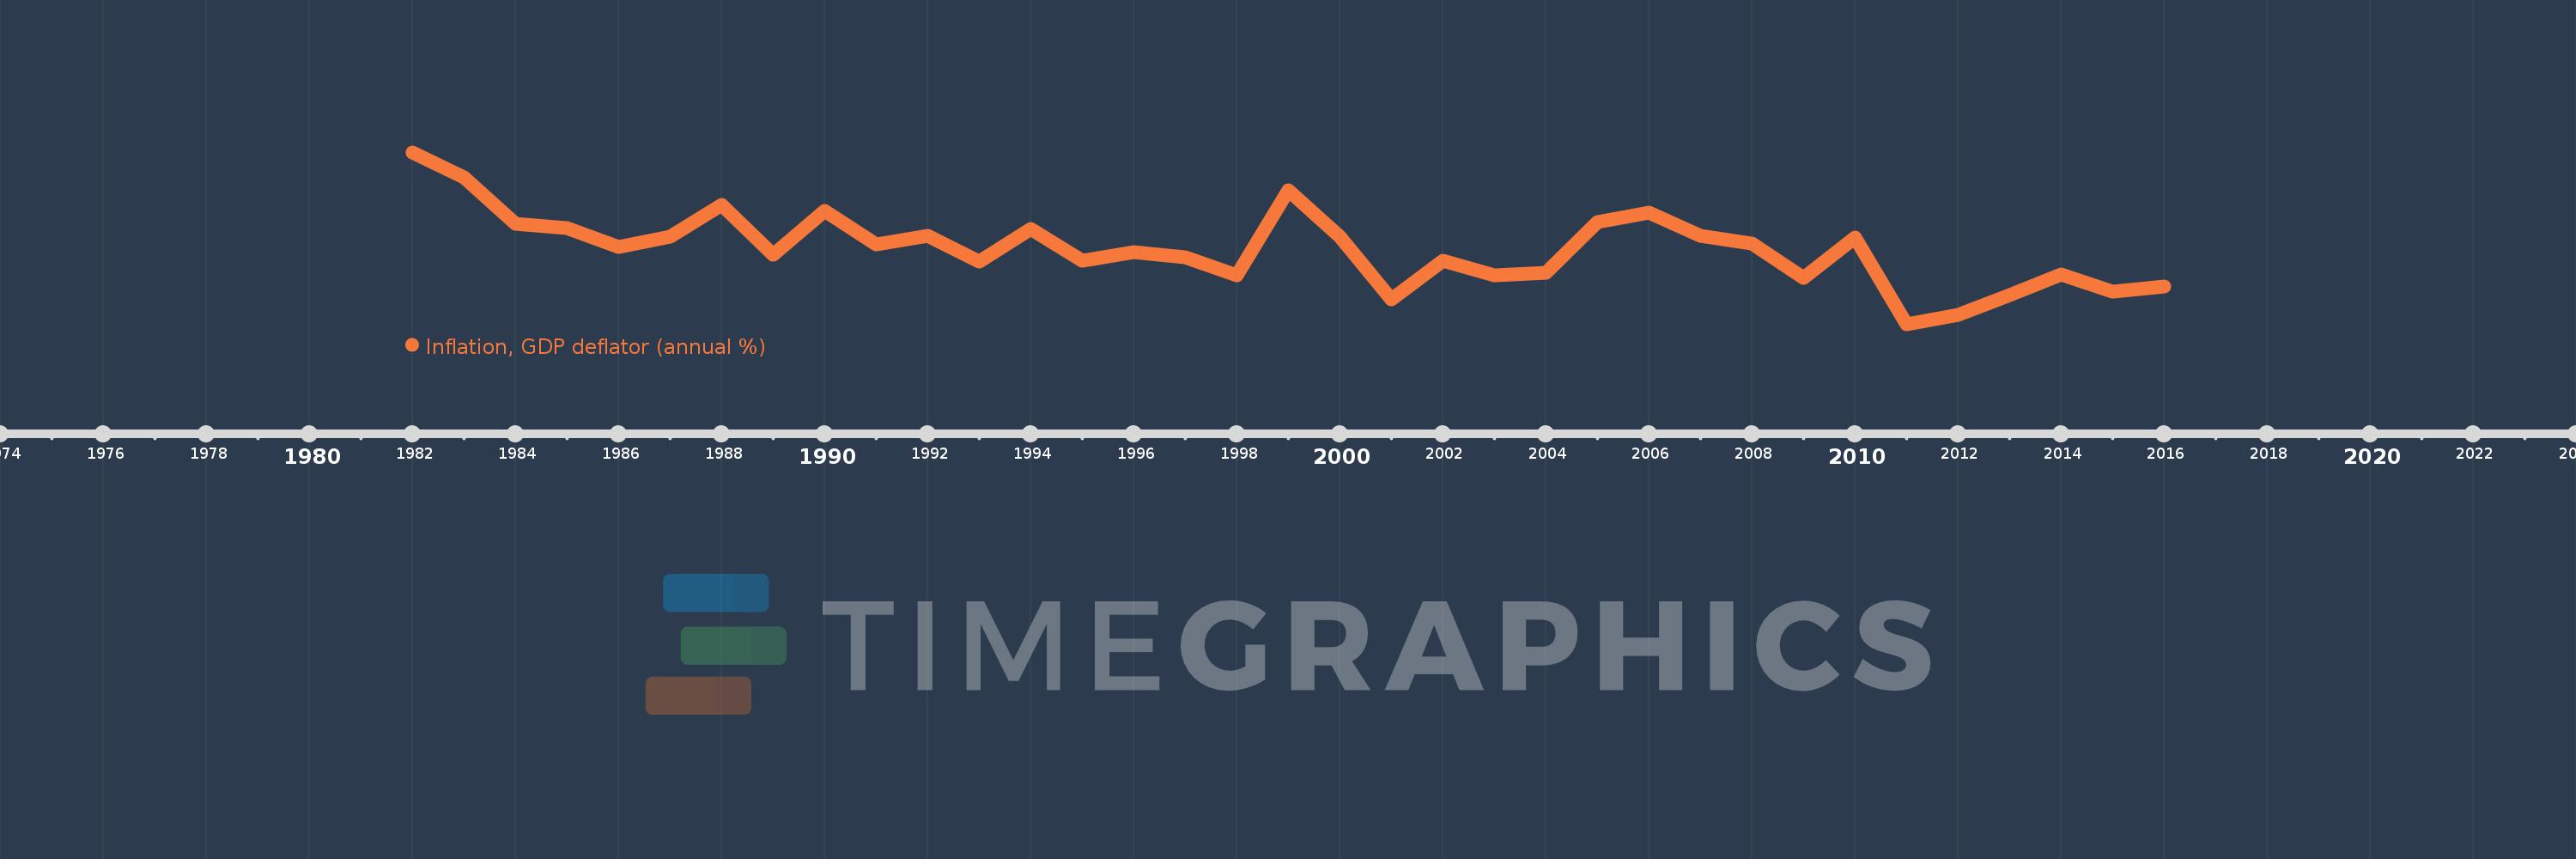
Inflation, GDP deflator (annual %)
2016,2015,2014,2013,2012,2011,2010,2009,2008,2007,2006,2005,2004,2003,2002,2001,2000,1999,1998,1997,1996,1995,1994,1993,1992,1991,1990,1989,1988,1987,1986,1985,1984,1983,1982
Cette statistique dans les autres pays:
AfghanistanAlbaniaAlgeriaAndorraAngolaAntigua and BarbudaArab WorldArgentinaArmeniaArubaAustraliaAustriaAzerbaijanBahamas, TheBahrainBangladeshBarbadosBelarusBelgiumBelizeBeninBermudaBhutanBoliviaBosnia and HerzegovinaBotswanaBrazilBrunei DarussalamBulgariaBurkina FasoBurundiCabo VerdeCambodiaCameroonCanadaCaribbean small statesCayman IslandsCentral African RepublicCentral Europe and the BalticsChadChannel IslandsChileChinaColombiaComorosCongo, Dem. Rep.Congo, Rep.Costa RicaCote d'IvoireCroatiaCubaCyprusCzech RepublicDenmarkDjiboutiDominicaDominican RepublicEarly-demographic dividendEast Asia & PacificEast Asia & Pacific (excluding high income)East Asia & Pacific (IDA & IBRD countries)EcuadorEgypt, Arab Rep.El SalvadorEquatorial GuineaEritreaEstoniaEthiopiaEuro areaEurope & Central AsiaEurope & Central Asia (excluding high income)Europe & Central Asia (IDA & IBRD countries)European UnionFijiFinlandFragile and conflict affected situationsFranceFrench PolynesiaGabonGambia, TheGeorgiaGermanyGhanaGreeceGreenlandGrenadaGuatemalaGuineaGuinea-BissauGuyanaHaitiHeavily indebted poor countries (HIPC)High incomeHondurasHong Kong SAR, ChinaHungaryIBRD onlyIcelandIDA & IBRD totalIDA blendIDA onlyIDA totalIndiaIndonesiaIran, Islamic Rep.IraqIrelandIsle of ManIsraelItalyJamaicaJapanJordanKazakhstanKenyaKiribatiKorea, Rep.KosovoKuwaitKyrgyz RepublicLao PDRLate-demographic dividendLatin America & Caribbean Latin America & Caribbean (excluding high income)Latin America & the Caribbean (IDA & IBRD countries)LatviaLeast developed countries: UN classificationLebanonLesothoLiberiaLibyaLiechtensteinLithuaniaLow & middle incomeLow incomeLower middle incomeLuxembourgMacao SAR, ChinaMacedonia, FYRMadagascarMalawiMalaysiaMaldivesMaliMaltaMarshall IslandsMauritaniaMauritiusMexicoMicronesia, Fed. Sts.Middle East & North AfricaMiddle East & North Africa (excluding high income)Middle East & North Africa (IDA & IBRD countries)Middle incomeMoldovaMonacoMongoliaMontenegroMoroccoMozambiqueMyanmarNamibiaNauruNepalNetherlandsNew CaledoniaNew ZealandNicaraguaNigerNigeriaNorth AmericaNorwayOECD membersOmanOther small statesPacific island small statesPakistanPalauPanamaPapua New GuineaParaguayPeruPhilippinesPolandPortugalPost-demographic dividendPre-demographic dividendPuerto RicoQatarRomaniaRussian FederationRwandaSamoaSan MarinoSao Tome and PrincipeSaudi ArabiaSenegalSerbiaSeychellesSierra LeoneSingaporeSlovak RepublicSloveniaSmall statesSolomon IslandsSomaliaSouth AfricaSouth AsiaSouth Asia (IDA & IBRD)South SudanSpainSri LankaSt. Kitts and NevisSt. LuciaSt. Vincent and the GrenadinesSub-Saharan Africa Sub-Saharan Africa (excluding high income)Sub-Saharan Africa (IDA & IBRD countries)SudanSurinameSwazilandSwedenSwitzerlandSyrian Arab RepublicTajikistanTanzaniaThailandTimor-LesteTogoTongaTrinidad and TobagoTunisiaTurkeyTurkmenistanTuvaluUgandaUkraineUnited Arab EmiratesUnited KingdomUnited StatesUpper middle incomeUruguayUzbekistanVanuatuVenezuela, RBVietnamVirgin Islands (U.S.)West Bank and GazaWorldYemen, Rep.ZambiaZimbabwe La ligne de temps
Cette échelle de temps montre un graphique de 1982 année à 2016 année Barbados. Les données jusqu'à 1981 année ne sont pas présentés. Quantité d'observations actuelles selon dates: 35.
Source (désignation):
Les indicateurs du développement mondiale
Source (organisation):
World Bank national accounts data, and OECD National Accounts data files.
Catégories:
Economy & Growth
Dernière mise à jour
23 avr. 2017
Les indicateurs de changement de valeurs selon les années
Minimum:
-3.602
1 janv. 2011
Maximum:
12.192
1 janv. 1982
Pour la date d''observation
Valeur
Changement absolu
Le changement par rapport à la valeur précédente
1 janv. 1982
12.192
+12.192
0.0%
1 janv. 1983
9.867
-2.325
-19.07%
1 janv. 1984
5.633
-4.235
-42.92%
1 janv. 1985
5.215
-0.417
-7.41%
1 janv. 1986
3.517
-1.699
-32.57%
1 janv. 1987
4.465
+0.948
26.97%
1 janv. 1988
7.33
+2.866
64.18%
1 janv. 1989
2.766
-4.564
-62.27%
1 janv. 1990
6.828
+4.062
146.85%
1 janv. 1991
3.717
-3.111
-45.56%
1 janv. 1992
4.495
+0.778
20.92%
1 janv. 1993
2.131
-2.364
-52.59%
1 janv. 1994
5.175
+3.044
142.84%
1 janv. 1995
2.221
-2.954
-57.08%
1 janv. 1996
3.061
+0.84
37.8%
1 janv. 1997
2.557
-0.504
-16.47%
1 janv. 1998
0.914
-1.643
-64.25%
1 janv. 1999
8.689
+7.775
850.7%
1 janv. 2000
4.447
-4.242
-48.82%
1 janv. 2001
-1.337
-5.784
-130.07%
1 janv. 2002
2.261
+3.598
-269.1%
1 janv. 2003
0.902
-1.359
-60.12%
1 janv. 2004
1.125
+0.223
24.74%
1 janv. 2005
5.825
+4.7
417.9%
1 janv. 2006
6.671
+0.846
14.53%
1 janv. 2007
4.489
-2.182
-32.71%
1 janv. 2008
3.812
-0.677
-15.09%
1 janv. 2009
0.682
-3.129
-82.1%
1 janv. 2010
4.336
+3.654
535.44%
1 janv. 2011
-3.602
-7.938
-183.06%
1 janv. 2012
-2.713
+0.889
-24.68%
1 janv. 2013
-0.91
+1.803
-66.45%
1 janv. 2014
0.974
+1.884
-207.07%
1 janv. 2015
-0.62
-1.594
-163.59%
1 janv. 2016
-0.134
+0.485
-78.34%
Classement des pays selon les statistiques actuelles par années


Commentaires: