29
/fr/
fr
AIzaSyAYiBZKx7MnpbEhh9jyipgxe19OcubqV5w
April 1, 2024
204229
Myanmar
MMR
true
2
1
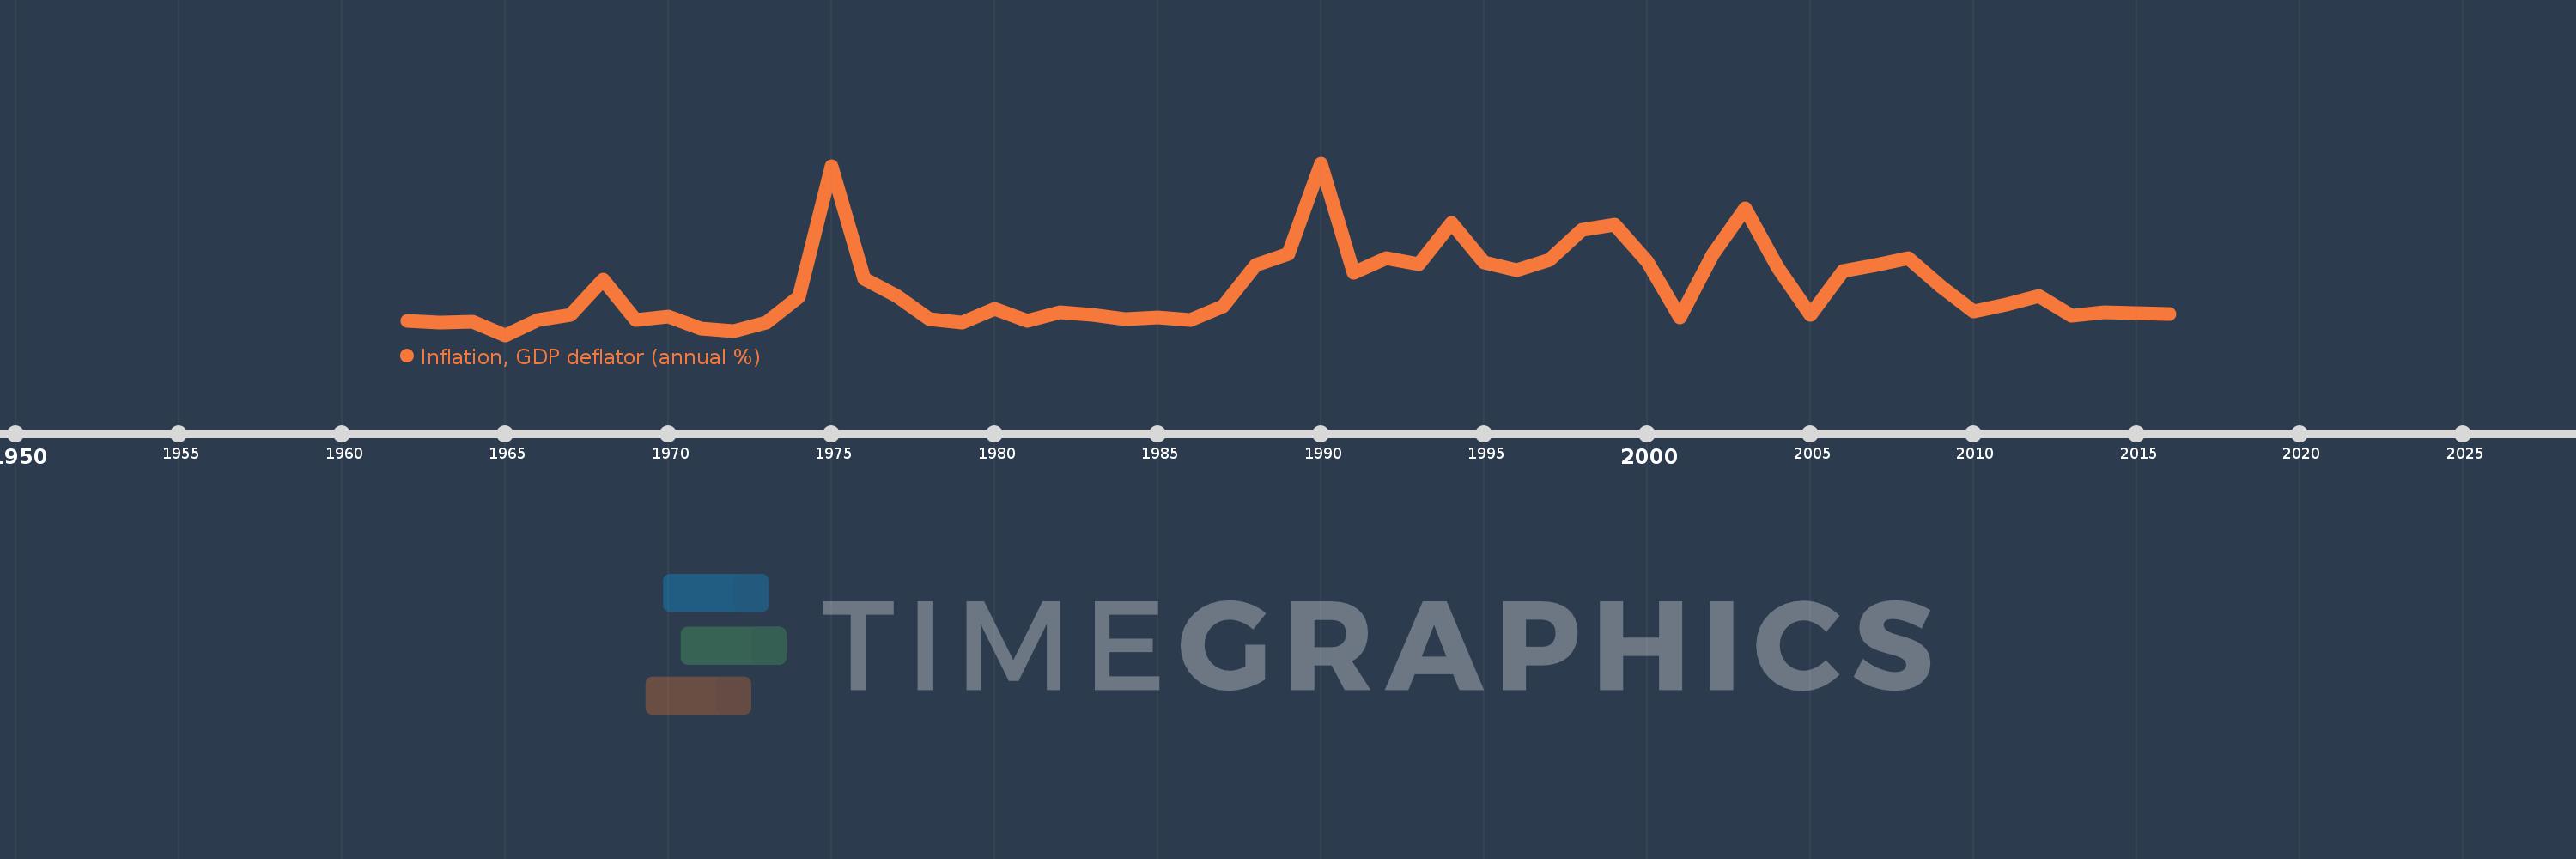
Inflation, GDP deflator (annual %)
2016,2015,2014,2013,2012,2011,2010,2009,2008,2007,2006,2005,2004,2003,2002,2001,2000,1999,1998,1997,1996,1995,1994,1993,1992,1991,1990,1989,1988,1987,1986,1985,1984,1983,1982,1981,1980,1979,1978,1977,1976,1975,1974,1973,1972,1971,1970,1969,1968,1967,1966,1965,1964,1963,1962
Cette statistique dans les autres pays:
AfghanistanAlbaniaAlgeriaAndorraAngolaAntigua and BarbudaArab WorldArgentinaArmeniaArubaAustraliaAustriaAzerbaijanBahamas, TheBahrainBangladeshBarbadosBelarusBelgiumBelizeBeninBermudaBhutanBoliviaBosnia and HerzegovinaBotswanaBrazilBrunei DarussalamBulgariaBurkina FasoBurundiCabo VerdeCambodiaCameroonCanadaCaribbean small statesCayman IslandsCentral African RepublicCentral Europe and the BalticsChadChannel IslandsChileChinaColombiaComorosCongo, Dem. Rep.Congo, Rep.Costa RicaCote d'IvoireCroatiaCubaCyprusCzech RepublicDenmarkDjiboutiDominicaDominican RepublicEarly-demographic dividendEast Asia & PacificEast Asia & Pacific (excluding high income)East Asia & Pacific (IDA & IBRD countries)EcuadorEgypt, Arab Rep.El SalvadorEquatorial GuineaEritreaEstoniaEthiopiaEuro areaEurope & Central AsiaEurope & Central Asia (excluding high income)Europe & Central Asia (IDA & IBRD countries)European UnionFijiFinlandFragile and conflict affected situationsFranceFrench PolynesiaGabonGambia, TheGeorgiaGermanyGhanaGreeceGreenlandGrenadaGuatemalaGuineaGuinea-BissauGuyanaHaitiHeavily indebted poor countries (HIPC)High incomeHondurasHong Kong SAR, ChinaHungaryIBRD onlyIcelandIDA & IBRD totalIDA blendIDA onlyIDA totalIndiaIndonesiaIran, Islamic Rep.IraqIrelandIsle of ManIsraelItalyJamaicaJapanJordanKazakhstanKenyaKiribatiKorea, Rep.KosovoKuwaitKyrgyz RepublicLao PDRLate-demographic dividendLatin America & Caribbean Latin America & Caribbean (excluding high income)Latin America & the Caribbean (IDA & IBRD countries)LatviaLeast developed countries: UN classificationLebanonLesothoLiberiaLibyaLiechtensteinLithuaniaLow & middle incomeLow incomeLower middle incomeLuxembourgMacao SAR, ChinaMacedonia, FYRMadagascarMalawiMalaysiaMaldivesMaliMaltaMarshall IslandsMauritaniaMauritiusMexicoMicronesia, Fed. Sts.Middle East & North AfricaMiddle East & North Africa (excluding high income)Middle East & North Africa (IDA & IBRD countries)Middle incomeMoldovaMonacoMongoliaMontenegroMoroccoMozambiqueMyanmarNamibiaNauruNepalNetherlandsNew CaledoniaNew ZealandNicaraguaNigerNigeriaNorth AmericaNorwayOECD membersOmanOther small statesPacific island small statesPakistanPalauPanamaPapua New GuineaParaguayPeruPhilippinesPolandPortugalPost-demographic dividendPre-demographic dividendPuerto RicoQatarRomaniaRussian FederationRwandaSamoaSan MarinoSao Tome and PrincipeSaudi ArabiaSenegalSerbiaSeychellesSierra LeoneSingaporeSlovak RepublicSloveniaSmall statesSolomon IslandsSomaliaSouth AfricaSouth AsiaSouth Asia (IDA & IBRD)South SudanSpainSri LankaSt. Kitts and NevisSt. LuciaSt. Vincent and the GrenadinesSub-Saharan Africa Sub-Saharan Africa (excluding high income)Sub-Saharan Africa (IDA & IBRD countries)SudanSurinameSwazilandSwedenSwitzerlandSyrian Arab RepublicTajikistanTanzaniaThailandTimor-LesteTogoTongaTrinidad and TobagoTunisiaTurkeyTurkmenistanTuvaluUgandaUkraineUnited Arab EmiratesUnited KingdomUnited StatesUpper middle incomeUruguayUzbekistanVanuatuVenezuela, RBVietnamVirgin Islands (U.S.)West Bank and GazaWorldYemen, Rep.ZambiaZimbabwe La ligne de temps
Cette échelle de temps montre un graphique de 1962 année à 2016 année Myanmar. Les données jusqu'à 1961 année ne sont pas présentés. Quantité d'observations actuelles selon dates: 55.
Source (désignation):
Les indicateurs du développement mondiale
Source (organisation):
World Bank national accounts data, and OECD National Accounts data files.
Catégories:
Economy & Growth
Dernière mise à jour
23 avr. 2017
Les indicateurs de changement de valeurs selon les années
Minimum:
-3.716
1 janv. 1965
Maximum:
57.684
1 janv. 1990
Pour la date d''observation
Valeur
Changement absolu
Le changement par rapport à la valeur précédente
1 janv. 1962
1.449
+1.449
0.0%
1 janv. 1963
0.601
-0.849
-58.55%
1 janv. 1964
0.944
+0.343
57.08%
1 janv. 1965
-3.716
-4.66
-493.77%
1 janv. 1966
1.691
+5.407
-145.5%
1 janv. 1967
3.555
+1.864
110.23%
1 janv. 1968
15.992
+12.436
349.81%
1 janv. 1969
1.693
-14.299
-89.41%
1 janv. 1970
2.762
+1.069
63.17%
1 janv. 1971
-1.429
-4.191
-151.72%
1 janv. 1972
-2.309
-0.881
61.66%
1 janv. 1973
0.755
+3.065
-132.71%
1 janv. 1974
10.005
+9.249
1.22 milles%
1 janv. 1975
56.521
+46.516
464.94%
1 janv. 1976
16.497
-40.024
-70.81%
1 janv. 1977
10.129
-6.368
-38.6%
1 janv. 1978
1.922
-8.207
-81.03%
1 janv. 1979
0.797
-1.124
-58.51%
1 janv. 1980
5.617
+4.819
604.41%
1 janv. 1981
1.235
-4.381
-78.01%
1 janv. 1982
4.425
+3.19
258.26%
1 janv. 1983
3.374
-1.051
-23.74%
1 janv. 1984
1.957
-1.417
-42.0%
1 janv. 1985
2.518
+0.561
28.64%
1 janv. 1986
1.567
-0.951
-37.76%
1 janv. 1987
6.555
+4.987
318.22%
1 janv. 1988
21.238
+14.684
224.03%
1 janv. 1989
25.196
+3.957
18.63%
1 janv. 1990
57.684
+32.489
128.95%
1 janv. 1991
18.54
-39.145
-67.86%
1 janv. 1992
23.749
+5.209
28.1%
1 janv. 1993
21.745
-2.003
-8.44%
1 janv. 1994
36.249
+14.504
66.7%
1 janv. 1995
22.08
-14.169
-39.09%
1 janv. 1996
19.601
-2.479
-11.23%
1 janv. 1997
23.037
+3.437
17.53%
1 janv. 1998
33.794
+10.757
46.69%
1 janv. 1999
35.825
+2.031
6.01%
1 janv. 2000
22.64
-13.185
-36.8%
1 janv. 2001
2.462
-20.179
-89.13%
1 janv. 2002
24.844
+22.383
909.21%
1 janv. 2003
41.509
+16.664
67.08%
1 janv. 2004
20.497
-21.012
-50.62%
1 janv. 2005
3.601
-16.895
-82.43%
1 janv. 2006
19.164
+15.562
432.15%
1 janv. 2007
21.3
+2.137
11.15%
1 janv. 2008
23.644
+2.343
11.0%
1 janv. 2009
13.619
-10.025
-42.4%
1 janv. 2010
4.879
-8.74
-64.18%
1 janv. 2011
7.043
+2.165
44.37%
1 janv. 2012
10.255
+3.211
45.6%
1 janv. 2013
3.13
-7.124
-69.48%
1 janv. 2014
4.378
+1.248
39.87%
1 janv. 2015
4.174
-0.205
-4.67%
1 janv. 2016
3.939
-0.235
-5.62%
Classement des pays selon les statistiques actuelles par années


Commentaires: