29
/fr/
fr
AIzaSyAYiBZKx7MnpbEhh9jyipgxe19OcubqV5w
April 1, 2024
77268
Bahrain
BHR
true
2
1
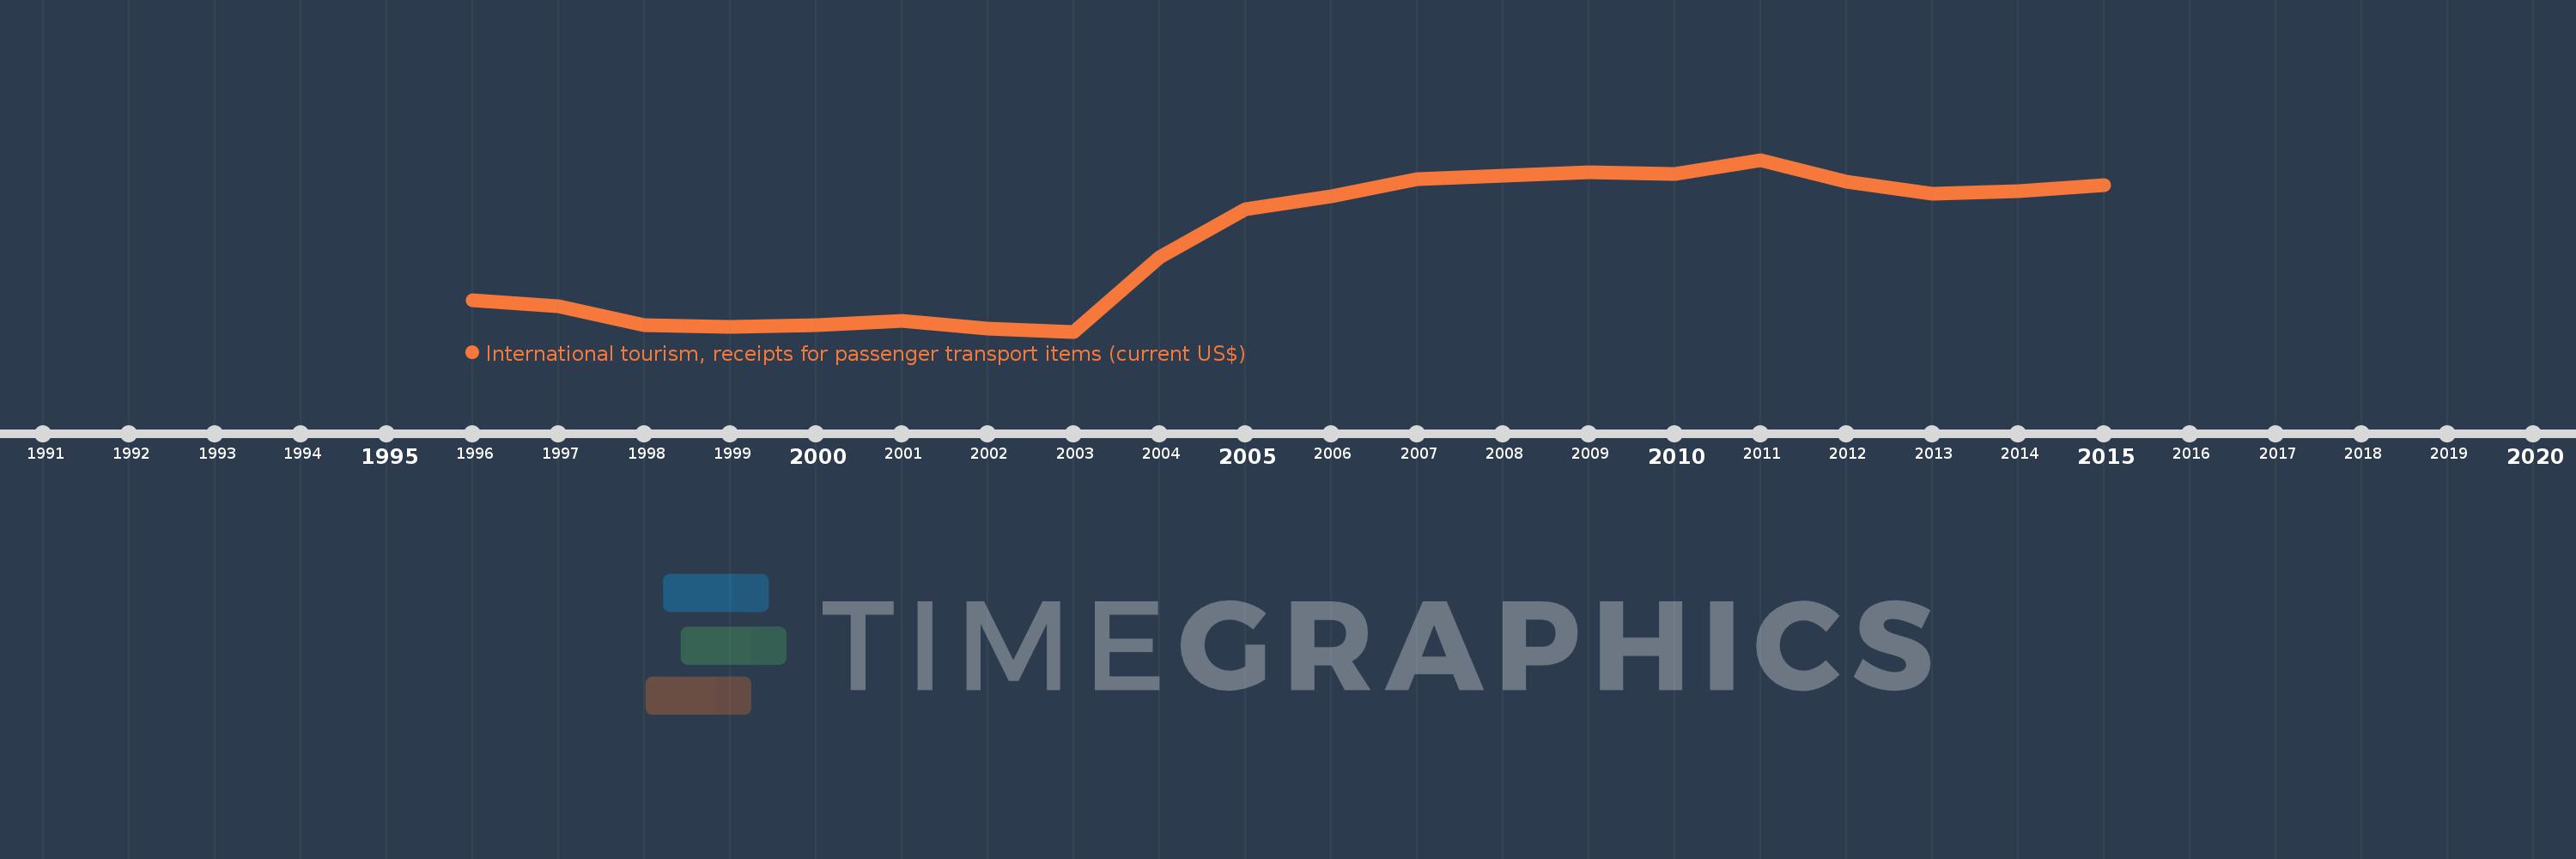
International tourism, receipts for passenger transport items (current US$)
2015,2014,2013,2012,2011,2010,2009,2008,2007,2006,2005,2004,2003,2002,2001,2000,1999,1998,1997,1996
Cette statistique dans les autres pays:
AfghanistanAlbaniaAlgeriaAngolaArgentinaArmeniaArubaAustraliaAustriaAzerbaijanBahamas, TheBahrainBangladeshBarbadosBelarusBelgiumBelizeBeninBermudaBhutanBoliviaBosnia and HerzegovinaBotswanaBrazilBulgariaBurkina FasoBurundiCabo VerdeCambodiaCameroonCanadaCaribbean small statesCentral African RepublicCentral Europe and the BalticsChileChinaColombiaComorosCongo, Rep.Costa RicaCote d'IvoireCroatiaCubaCuracaoCyprusCzech RepublicEarly-demographic dividendEast Asia & PacificEast Asia & Pacific (excluding high income)East Asia & Pacific (IDA & IBRD countries)EcuadorEgypt, Arab Rep.El SalvadorEstoniaEthiopiaEuro areaEurope & Central AsiaEurope & Central Asia (excluding high income)Europe & Central Asia (IDA & IBRD countries)European UnionFijiFinlandFragile and conflict affected situationsFranceFrench PolynesiaGabonGambia, TheGeorgiaGermanyGhanaGreeceGuatemalaGuineaGuinea-BissauGuyanaHigh incomeHondurasHong Kong SAR, ChinaHungaryIBRD onlyIcelandIDA & IBRD totalIndiaIndonesiaIran, Islamic Rep.IraqIrelandIsraelItalyJamaicaJapanJordanKazakhstanKenyaKiribatiKorea, Rep.KuwaitKyrgyz RepublicLao PDRLate-demographic dividendLatin America & Caribbean Latin America & Caribbean (excluding high income)Latin America & the Caribbean (IDA & IBRD countries)LatviaLebanonLesothoLibyaLithuaniaLow & middle incomeLuxembourgMacao SAR, ChinaMacedonia, FYRMadagascarMalawiMalaysiaMaliMaltaMarshall IslandsMauritaniaMauritiusMexicoMiddle East & North AfricaMiddle East & North Africa (excluding high income)Middle East & North Africa (IDA & IBRD countries)Middle incomeMoldovaMongoliaMontenegroMoroccoMozambiqueMyanmarNamibiaNepalNetherlandsNicaraguaNigerNigeriaNorth AmericaNorwayOECD membersOmanPacific island small statesPakistanPalauPanamaPapua New GuineaParaguayPeruPhilippinesPolandPortugalPost-demographic dividendPre-demographic dividendQatarRomaniaRussian FederationRwandaSamoaSao Tome and PrincipeSaudi ArabiaSenegalSerbiaSeychellesSint Maarten (Dutch part)Slovak RepublicSloveniaSolomon IslandsSouth AfricaSpainSri LankaSub-Saharan Africa Sub-Saharan Africa (excluding high income)Sub-Saharan Africa (IDA & IBRD countries)SurinameSwazilandSwedenSwitzerlandSyrian Arab RepublicTajikistanTanzaniaThailandTogoTongaTrinidad and TobagoTunisiaTurkeyTurkmenistanUgandaUkraineUnited KingdomUnited StatesUpper middle incomeUruguayUzbekistanVanuatuVenezuela, RBWorld La ligne de temps
Cette échelle de temps montre un graphique de 1996 année à 2015 année Bahrain. Les données jusqu'à 1995 année ne sont pas présentés. Quantité d'observations actuelles selon dates: 20.
Source (désignation):
Les indicateurs du développement mondiale
Source (organisation):
World Tourism Organization, Yearbook of Tourism Statistics, Compendium of Tourism Statistics and data files.
Catégories:
Private Sector, Trade
Dernière mise à jour
23 avr. 2017
Les indicateurs de changement de valeurs selon les années
Minimum:
245.0 mln.
1 janv. 2003
Maximum:
801.0 mln.
1 janv. 2011
Pour la date d''observation
Valeur
Changement absolu
Le changement par rapport à la valeur précédente
1 janv. 1996
346.0 mln.
+346.0 mln.
0.0%
1 janv. 1997
326.0 mln.
-20.0 mln.
-5.78%
1 janv. 1998
267.0 mln.
-59.0 mln.
-18.1%
1 janv. 1999
259.0 mln.
-8.0 mln.
-3.0%
1 janv. 2000
267.0 mln.
+8.0 mln.
3.09%
1 janv. 2001
281.0 mln.
+14.0 mln.
5.24%
1 janv. 2002
256.0 mln.
-25.0 mln.
-8.9%
1 janv. 2003
245.0 mln.
-11.0 mln.
-4.3%
1 janv. 2004
486.0 mln.
+241.0 mln.
98.37%
1 janv. 2005
640.0 mln.
+154.0 mln.
31.69%
1 janv. 2006
683.0 mln.
+43.0 mln.
6.72%
1 janv. 2007
738.0 mln.
+55.0 mln.
8.05%
1 janv. 2008
749.0 mln.
+11.0 mln.
1.49%
1 janv. 2009
761.0 mln.
+12.0 mln.
1.6%
1 janv. 2010
755.0 mln.
-6.0 mln.
-0.79%
1 janv. 2011
801.0 mln.
+46.0 mln.
6.09%
1 janv. 2012
731.0 mln.
-70.0 mln.
-8.74%
1 janv. 2013
691.0 mln.
-40.0 mln.
-5.47%
1 janv. 2014
700.0 mln.
+9.0 mln.
1.3%
1 janv. 2015
718.0 mln.
+18.0 mln.
2.57%
Classement des pays selon les statistiques actuelles par années


Commentaires: