29
/fr/
fr
AIzaSyAYiBZKx7MnpbEhh9jyipgxe19OcubqV5w
April 1, 2024
124983
Egypt, Arab Rep.
EGY
true
2
1
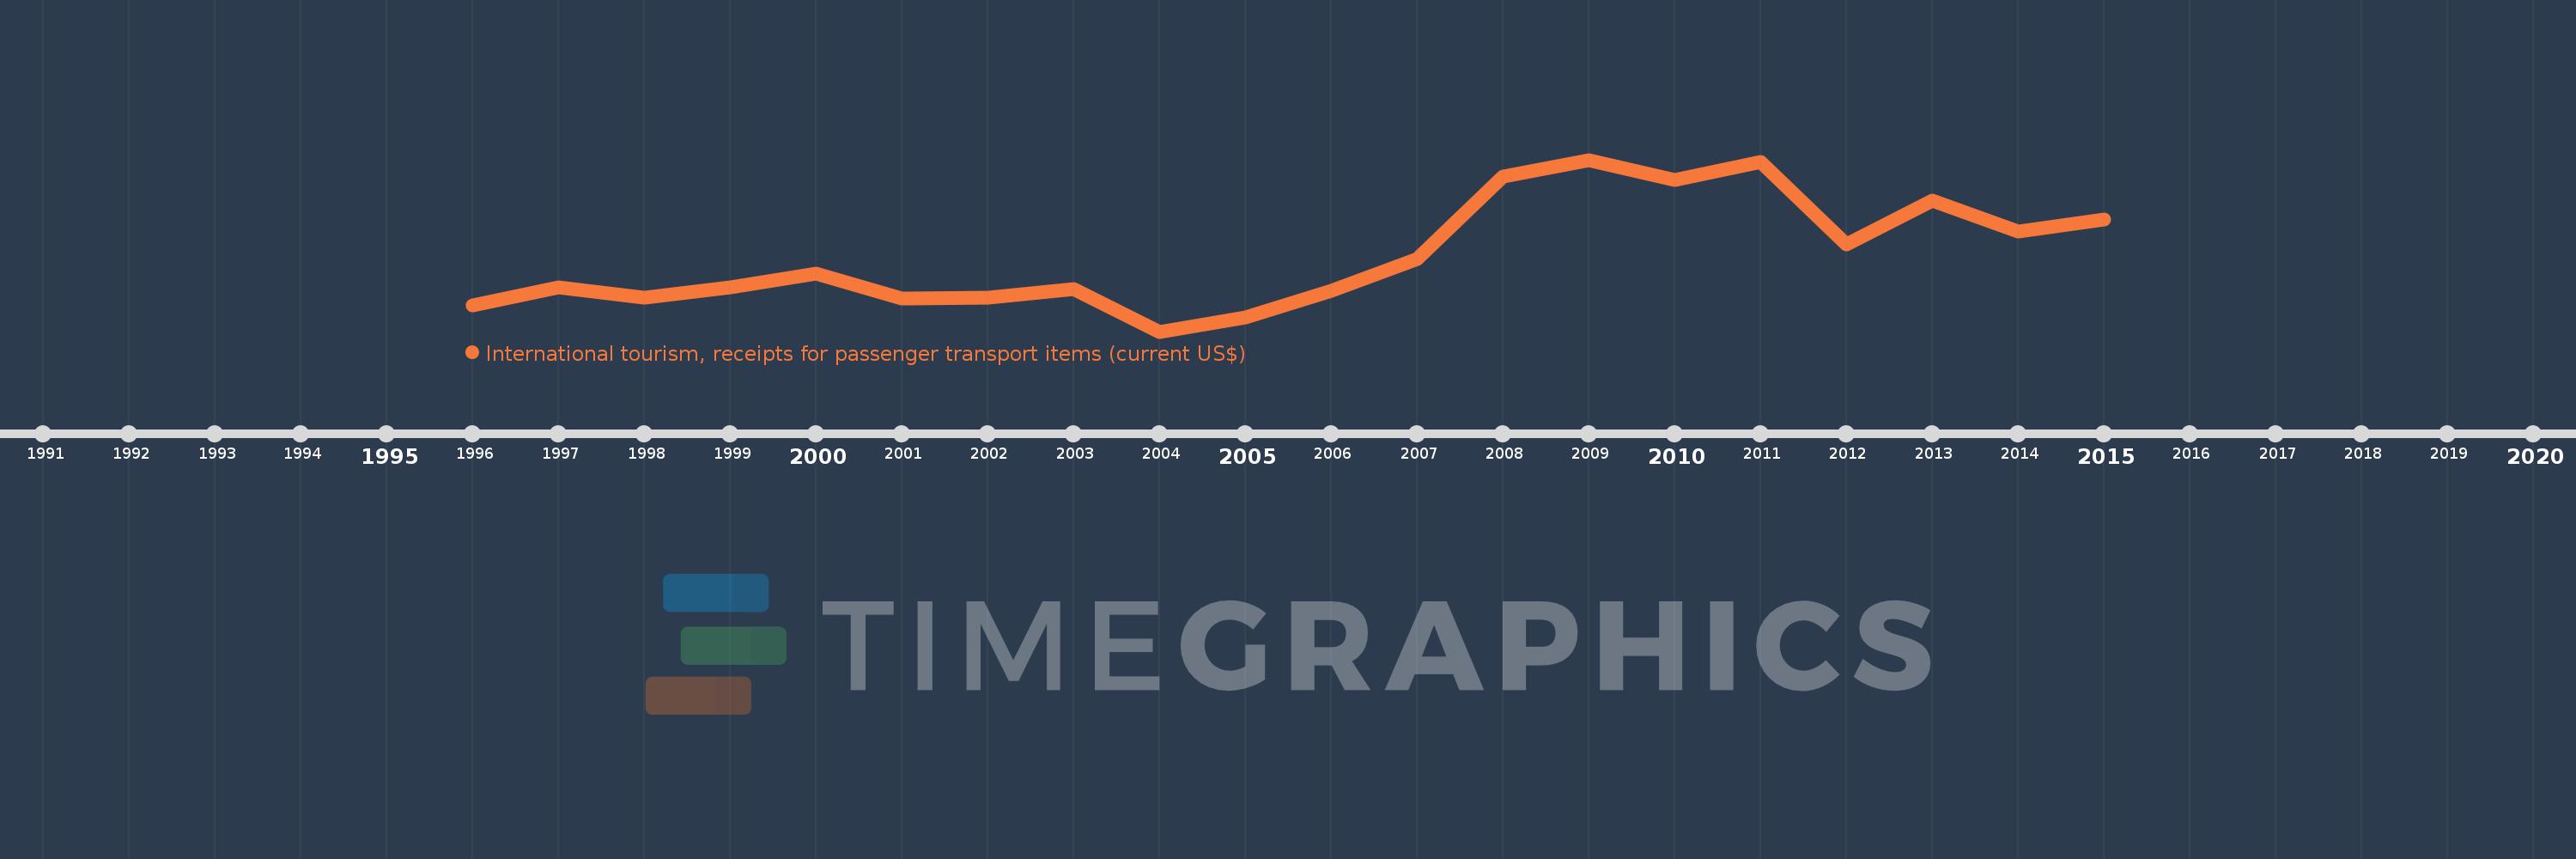
International tourism, receipts for passenger transport items (current US$)
2015,2014,2013,2012,2011,2010,2009,2008,2007,2006,2005,2004,2003,2002,2001,2000,1999,1998,1997,1996
Cette statistique dans les autres pays:
AfghanistanAlbaniaAlgeriaAngolaArgentinaArmeniaArubaAustraliaAustriaAzerbaijanBahamas, TheBahrainBangladeshBarbadosBelarusBelgiumBelizeBeninBermudaBhutanBoliviaBosnia and HerzegovinaBotswanaBrazilBulgariaBurkina FasoBurundiCabo VerdeCambodiaCameroonCanadaCaribbean small statesCentral African RepublicCentral Europe and the BalticsChileChinaColombiaComorosCongo, Rep.Costa RicaCote d'IvoireCroatiaCubaCuracaoCyprusCzech RepublicEarly-demographic dividendEast Asia & PacificEast Asia & Pacific (excluding high income)East Asia & Pacific (IDA & IBRD countries)EcuadorEgypt, Arab Rep.El SalvadorEstoniaEthiopiaEuro areaEurope & Central AsiaEurope & Central Asia (excluding high income)Europe & Central Asia (IDA & IBRD countries)European UnionFijiFinlandFragile and conflict affected situationsFranceFrench PolynesiaGabonGambia, TheGeorgiaGermanyGhanaGreeceGuatemalaGuineaGuinea-BissauGuyanaHigh incomeHondurasHong Kong SAR, ChinaHungaryIBRD onlyIcelandIDA & IBRD totalIndiaIndonesiaIran, Islamic Rep.IraqIrelandIsraelItalyJamaicaJapanJordanKazakhstanKenyaKiribatiKorea, Rep.KuwaitKyrgyz RepublicLao PDRLate-demographic dividendLatin America & Caribbean Latin America & Caribbean (excluding high income)Latin America & the Caribbean (IDA & IBRD countries)LatviaLebanonLesothoLibyaLithuaniaLow & middle incomeLuxembourgMacao SAR, ChinaMacedonia, FYRMadagascarMalawiMalaysiaMaliMaltaMarshall IslandsMauritaniaMauritiusMexicoMiddle East & North AfricaMiddle East & North Africa (excluding high income)Middle East & North Africa (IDA & IBRD countries)Middle incomeMoldovaMongoliaMontenegroMoroccoMozambiqueMyanmarNamibiaNepalNetherlandsNicaraguaNigerNigeriaNorth AmericaNorwayOECD membersOmanPacific island small statesPakistanPalauPanamaPapua New GuineaParaguayPeruPhilippinesPolandPortugalPost-demographic dividendPre-demographic dividendQatarRomaniaRussian FederationRwandaSamoaSao Tome and PrincipeSaudi ArabiaSenegalSerbiaSeychellesSint Maarten (Dutch part)Slovak RepublicSloveniaSolomon IslandsSouth AfricaSpainSri LankaSub-Saharan Africa Sub-Saharan Africa (excluding high income)Sub-Saharan Africa (IDA & IBRD countries)SurinameSwazilandSwedenSwitzerlandSyrian Arab RepublicTajikistanTanzaniaThailandTogoTongaTrinidad and TobagoTunisiaTurkeyTurkmenistanUgandaUkraineUnited KingdomUnited StatesUpper middle incomeUruguayUzbekistanVanuatuVenezuela, RBWorld La ligne de temps
Cette échelle de temps montre un graphique de 1996 année à 2015 année Egypt, Arab Rep.. Les données jusqu'à 1995 année ne sont pas présentés. Quantité d'observations actuelles selon dates: 20.
Source (désignation):
Les indicateurs du développement mondiale
Source (organisation):
World Tourism Organization, Yearbook of Tourism Statistics, Compendium of Tourism Statistics and data files.
Catégories:
Private Sector, Trade
Dernière mise à jour
23 avr. 2017
Les indicateurs de changement de valeurs selon les années
Minimum:
120.0 mln.
1 janv. 2004
Maximum:
1.119 mds
1 janv. 2009
Pour la date d''observation
Valeur
Changement absolu
Le changement par rapport à la valeur précédente
1 janv. 1996
270.0 mln.
+270.0 mln.
0.0%
1 janv. 1997
379.0 mln.
+109.0 mln.
40.37%
1 janv. 1998
318.8 mln.
-60.2 mln.
-15.88%
1 janv. 1999
377.0 mln.
+58.2 mln.
18.26%
1 janv. 2000
458.0 mln.
+81.0 mln.
21.49%
1 janv. 2001
312.0 mln.
-146.0 mln.
-31.88%
1 janv. 2002
319.0 mln.
+7.0 mln.
2.24%
1 janv. 2003
369.0 mln.
+50.0 mln.
15.67%
1 janv. 2004
120.0 mln.
-249.0 mln.
-67.48%
1 janv. 2005
203.0 mln.
+83.0 mln.
69.17%
1 janv. 2006
355.0 mln.
+152.0 mln.
74.88%
1 janv. 2007
542.0 mln.
+187.0 mln.
52.68%
1 janv. 2008
1.024 mds
+482.0 mln.
88.93%
1 janv. 2009
1.119 mds
+95.0 mln.
9.28%
1 janv. 2010
1.002 mds
-117.0 mln.
-10.46%
1 janv. 2011
1.105 mds
+103.0 mln.
10.28%
1 janv. 2012
626.0 mln.
-479.0 mln.
-43.35%
1 janv. 2013
883.0 mln.
+257.0 mln.
41.05%
1 janv. 2014
700.0 mln.
-183.0 mln.
-20.72%
1 janv. 2015
771.0 mln.
+71.0 mln.
10.14%
Classement des pays selon les statistiques actuelles par années


Commentaires: