29
/fr/
fr
AIzaSyAYiBZKx7MnpbEhh9jyipgxe19OcubqV5w
April 1, 2024
73651
Austria
AUT
true
2
1
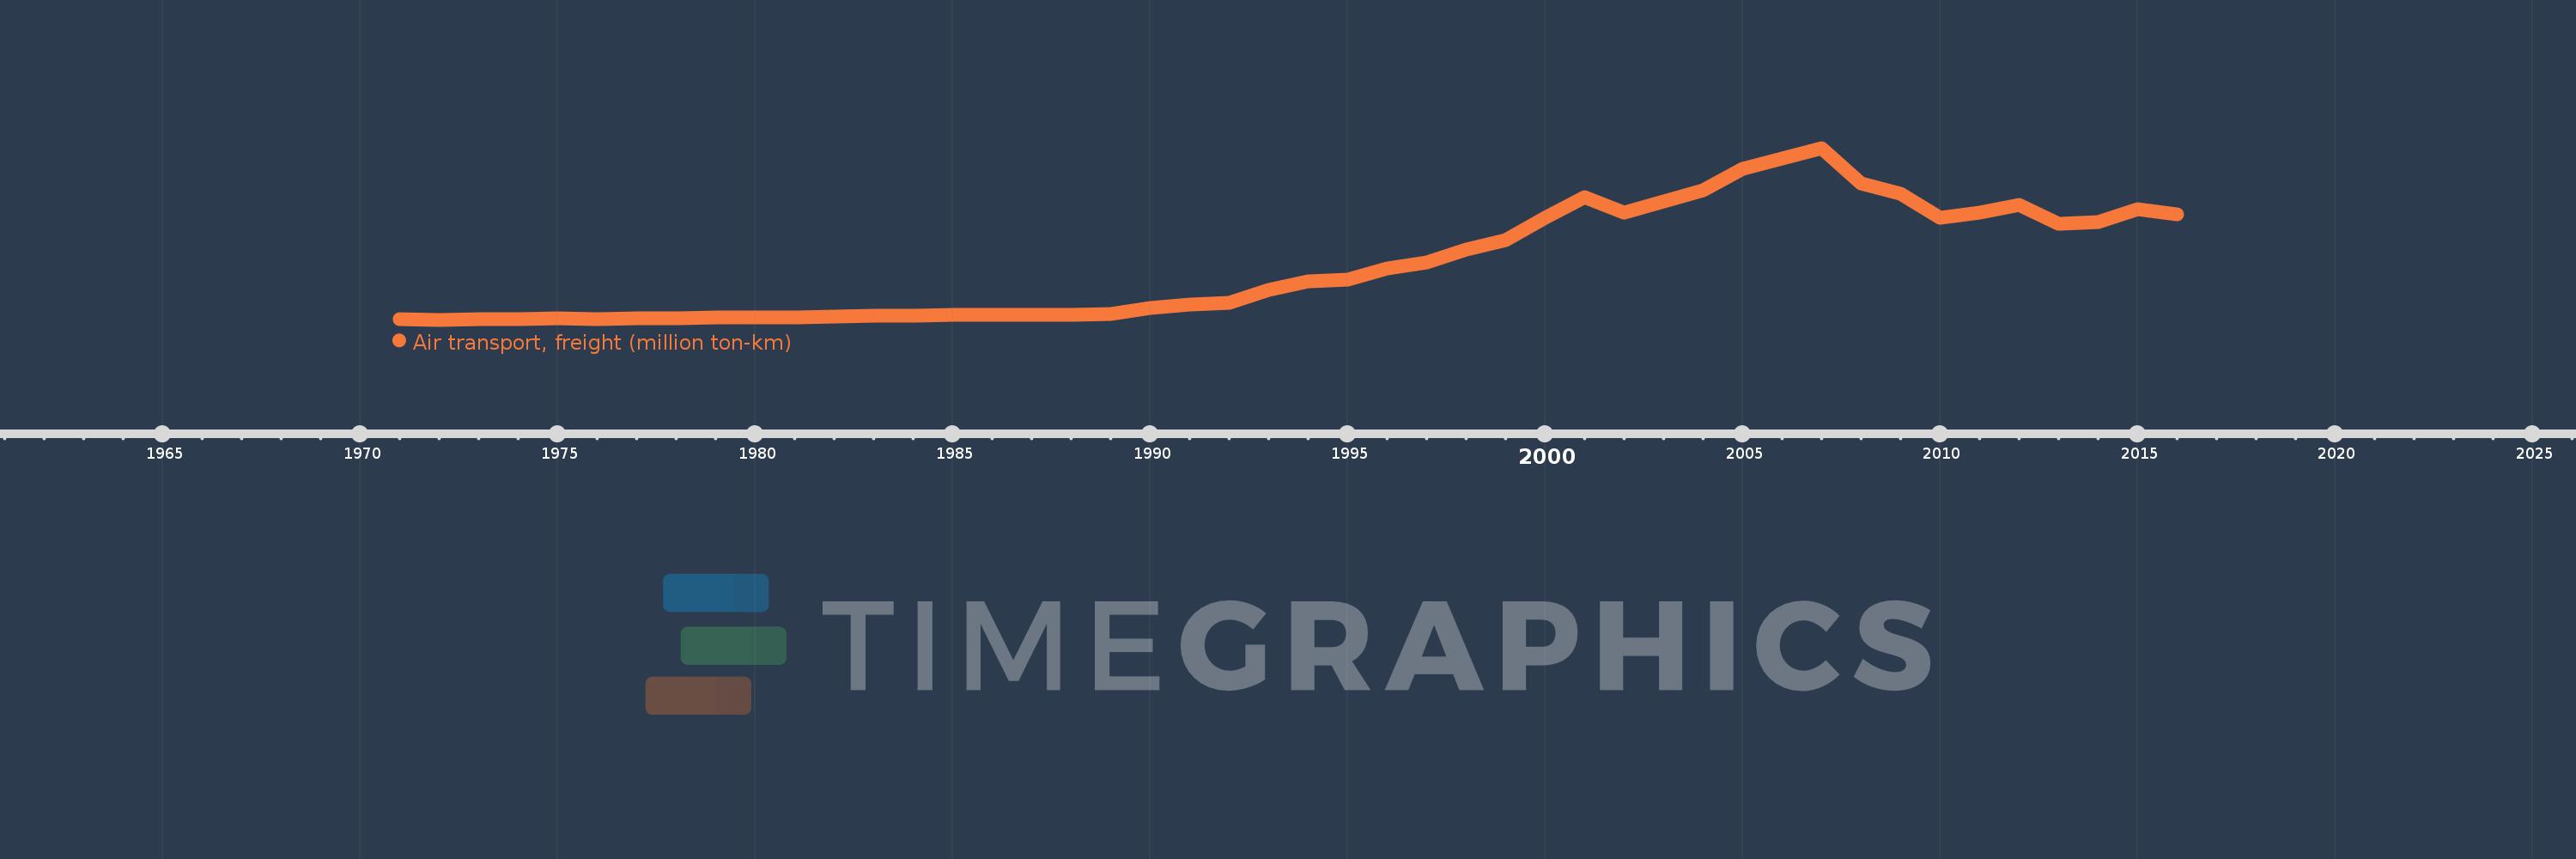
Air transport, freight (million ton-km)
2016,2015,2014,2013,2012,2011,2010,2009,2008,2007,2006,2005,2004,2003,2002,2001,2000,1999,1998,1997,1996,1995,1994,1993,1992,1991,1990,1989,1988,1987,1986,1985,1984,1983,1982,1981,1980,1979,1978,1977,1976,1975,1974,1973,1972,1971
Cette statistique dans les autres pays:
AfghanistanAlbaniaAlgeriaAmerican SamoaAngolaAntigua and BarbudaArab WorldArgentinaArmeniaAustraliaAustriaAzerbaijanBahamas, TheBahrainBangladeshBarbadosBelarusBelgiumBelizeBeninBhutanBoliviaBosnia and HerzegovinaBotswanaBrazilBrunei DarussalamBulgariaBurkina FasoBurundiCabo VerdeCambodiaCameroonCanadaCaribbean small statesCentral African RepublicCentral Europe and the BalticsChadChileChinaColombiaComorosCongo, Dem. Rep.Congo, Rep.Costa RicaCote d'IvoireCroatiaCubaCyprusCzech RepublicDenmarkDjiboutiDominican RepublicEarly-demographic dividendEast Asia & PacificEast Asia & Pacific (excluding high income)East Asia & Pacific (IDA & IBRD countries)EcuadorEgypt, Arab Rep.El SalvadorEquatorial GuineaEritreaEstoniaEthiopiaEuro areaEurope & Central AsiaEurope & Central Asia (excluding high income)Europe & Central Asia (IDA & IBRD countries)European UnionFijiFinlandFragile and conflict affected situationsFranceGabonGambia, TheGeorgiaGermanyGhanaGreeceGuamGuatemalaGuineaGuinea-BissauGuyanaHaitiHeavily indebted poor countries (HIPC)High incomeHondurasHong Kong SAR, ChinaHungaryIBRD onlyIcelandIDA & IBRD totalIDA blendIDA onlyIDA totalIndiaIndonesiaIran, Islamic Rep.IraqIrelandIsraelItalyJamaicaJapanJordanKazakhstanKenyaKiribatiKorea, Dem. People’s Rep.Korea, Rep.KuwaitKyrgyz RepublicLao PDRLate-demographic dividendLatin America & Caribbean Latin America & Caribbean (excluding high income)Latin America & the Caribbean (IDA & IBRD countries)LatviaLeast developed countries: UN classificationLebanonLesothoLiberiaLibyaLithuaniaLow & middle incomeLow incomeLower middle incomeLuxembourgMacao SAR, ChinaMacedonia, FYRMadagascarMalawiMalaysiaMaldivesMaliMaltaMarshall IslandsMauritaniaMauritiusMexicoMiddle East & North AfricaMiddle East & North Africa (excluding high income)Middle East & North Africa (IDA & IBRD countries)Middle incomeMoldovaMonacoMongoliaMontenegroMoroccoMozambiqueMyanmarNamibiaNauruNepalNetherlandsNew ZealandNicaraguaNigerNigeriaNorth AmericaNorwayOECD membersOmanOther small statesPacific island small statesPakistanPanamaPapua New GuineaParaguayPeruPhilippinesPolandPortugalPost-demographic dividendPre-demographic dividendQatarRomaniaRussian FederationRwandaSamoaSao Tome and PrincipeSaudi ArabiaSenegalSerbiaSeychellesSierra LeoneSingaporeSlovak RepublicSloveniaSmall statesSolomon IslandsSomaliaSouth AfricaSouth AsiaSouth Asia (IDA & IBRD)SpainSri LankaSub-Saharan Africa Sub-Saharan Africa (excluding high income)Sub-Saharan Africa (IDA & IBRD countries)SudanSurinameSwazilandSwedenSwitzerlandSyrian Arab RepublicTajikistanTanzaniaThailandTogoTongaTrinidad and TobagoTunisiaTurkeyTurkmenistanUgandaUkraineUnited Arab EmiratesUnited KingdomUnited StatesUpper middle incomeUruguayUzbekistanVanuatuVenezuela, RBVietnamWorldYemen, Rep.ZambiaZimbabwe La ligne de temps
Cette échelle de temps montre un graphique de 1971 année à 2016 année Austria. Les données jusqu'à 1970 année ne sont pas présentés. Quantité d'observations actuelles selon dates: 46.
Source (désignation):
Les indicateurs du développement mondiale
Source (organisation):
International Civil Aviation Organization, Civil Aviation Statistics of the World and ICAO staff estimates.
Catégories:
Infrastructure
Dernière mise à jour
23 avr. 2017
Les indicateurs de changement de valeurs selon les années
Maximum:
571.977
1 janv. 2007
Pour la date d''observation
Valeur
Changement absolu
Le changement par rapport à la valeur précédente
1 janv. 1971
5.9
+5.9
0.0%
1 janv. 1972
3.1
-2.8
-47.46%
1 janv. 1973
4.7
+1.6
51.61%
1 janv. 1974
6.3
+1.6
34.04%
1 janv. 1975
6.8
+0.5
7.94%
1 janv. 1976
6.5
-0.3
-4.41%
1 janv. 1977
8.1
+1.6
24.62%
1 janv. 1978
9.2
+1.1
13.58%
1 janv. 1979
10.3
+1.1
11.96%
1 janv. 1980
11.7
+1.4
13.59%
1 janv. 1981
11.7
0.0
0.0%
1 janv. 1982
13.5
+1.8
15.38%
1 janv. 1983
16.6
+3.1
22.96%
1 janv. 1984
17.2
+0.6
3.61%
1 janv. 1985
19.5
+2.3
13.37%
1 janv. 1986
19.4
-0.1
-0.51%
1 janv. 1987
19.6
+0.2
1.03%
1 janv. 1988
19.5
-0.1
-0.51%
1 janv. 1989
22.9
+3.4
17.44%
1 janv. 1990
41.6
+18.7
81.66%
1 janv. 1991
53.9
+12.3
29.57%
1 janv. 1992
59.2
+5.3
9.83%
1 janv. 1993
100.6
+41.4
69.93%
1 janv. 1994
129.6
+29.0
28.83%
1 janv. 1995
136.4
+6.8
5.25%
1 janv. 1996
173.3
+36.9
27.05%
1 janv. 1997
192.1
+18.8
10.85%
1 janv. 1998
236.3
+44.2
23.01%
1 janv. 1999
265.5
+29.2
12.36%
1 janv. 2000
340.8
+75.3
28.36%
1 janv. 2001
407.769
+66.969
19.65%
1 janv. 2002
357.975
-49.794
-12.21%
1 janv. 2003
396.021
+38.046
10.63%
1 janv. 2004
430.701
+34.68
8.76%
1 janv. 2005
502.302
+71.601
16.62%
1 janv. 2006
537.472
+35.17
7.0%
1 janv. 2007
571.977
+34.505
6.42%
1 janv. 2008
453.759
-118.218
-20.67%
1 janv. 2009
420.794
-32.965
-7.26%
1 janv. 2010
341.511
-79.283
-18.84%
1 janv. 2011
357.885
+16.374
4.79%
1 janv. 2012
383.371
+25.486
7.12%
1 janv. 2013
322.104
-61.267
-15.98%
1 janv. 2014
326.399
+4.295
1.33%
1 janv. 2015
369.955
+43.556
13.34%
1 janv. 2016
351.379
-18.576
-5.02%
Classement des pays selon les statistiques actuelles par années


Commentaires: