29
/fr/
fr
AIzaSyAYiBZKx7MnpbEhh9jyipgxe19OcubqV5w
April 1, 2024
124448
Egypt, Arab Rep.
EGY
true
2
1
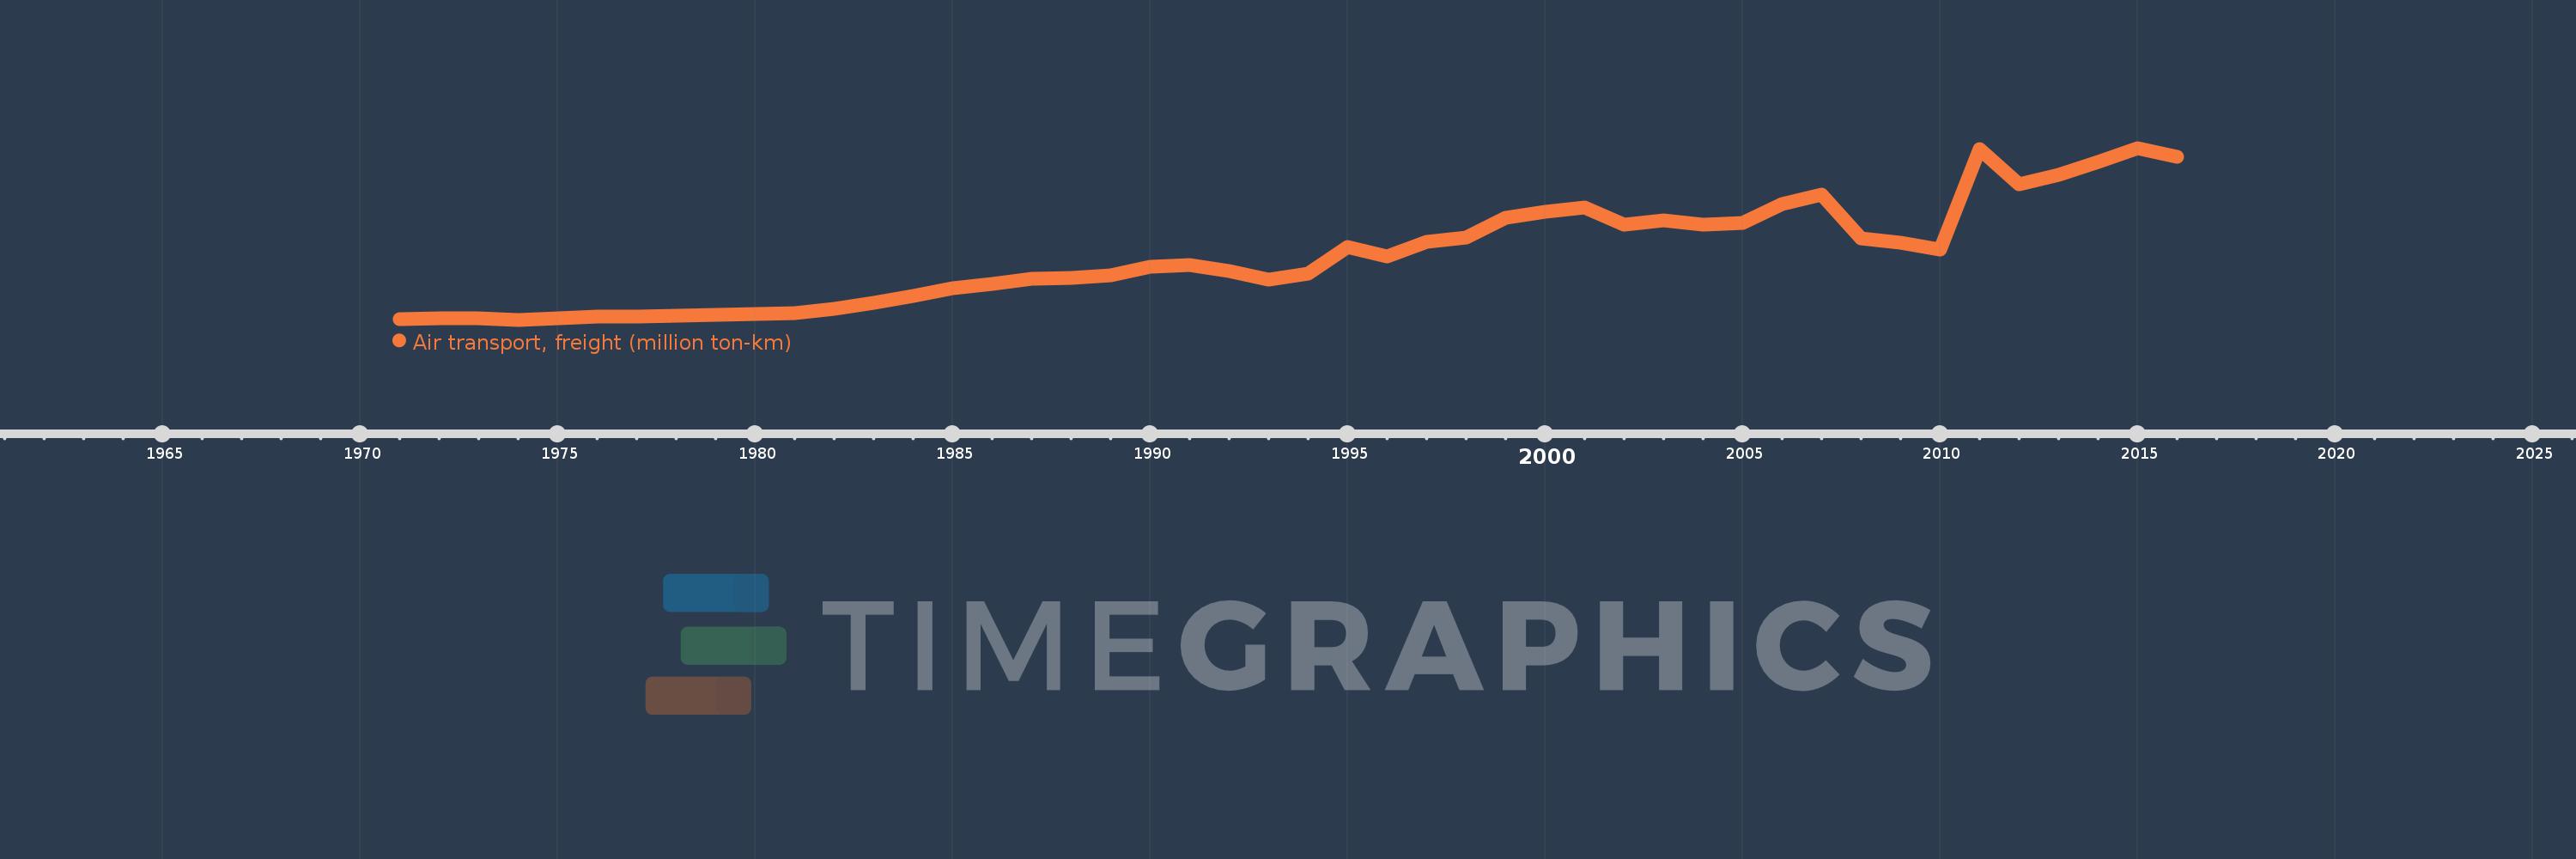
Air transport, freight (million ton-km)
2016,2015,2014,2013,2012,2011,2010,2009,2008,2007,2006,2005,2004,2003,2002,2001,2000,1999,1998,1997,1996,1995,1994,1993,1992,1991,1990,1989,1988,1987,1986,1985,1984,1983,1982,1981,1980,1979,1978,1977,1976,1975,1974,1973,1972,1971
Cette statistique dans les autres pays:
AfghanistanAlbaniaAlgeriaAmerican SamoaAngolaAntigua and BarbudaArab WorldArgentinaArmeniaAustraliaAustriaAzerbaijanBahamas, TheBahrainBangladeshBarbadosBelarusBelgiumBelizeBeninBhutanBoliviaBosnia and HerzegovinaBotswanaBrazilBrunei DarussalamBulgariaBurkina FasoBurundiCabo VerdeCambodiaCameroonCanadaCaribbean small statesCentral African RepublicCentral Europe and the BalticsChadChileChinaColombiaComorosCongo, Dem. Rep.Congo, Rep.Costa RicaCote d'IvoireCroatiaCubaCyprusCzech RepublicDenmarkDjiboutiDominican RepublicEarly-demographic dividendEast Asia & PacificEast Asia & Pacific (excluding high income)East Asia & Pacific (IDA & IBRD countries)EcuadorEgypt, Arab Rep.El SalvadorEquatorial GuineaEritreaEstoniaEthiopiaEuro areaEurope & Central AsiaEurope & Central Asia (excluding high income)Europe & Central Asia (IDA & IBRD countries)European UnionFijiFinlandFragile and conflict affected situationsFranceGabonGambia, TheGeorgiaGermanyGhanaGreeceGuamGuatemalaGuineaGuinea-BissauGuyanaHaitiHeavily indebted poor countries (HIPC)High incomeHondurasHong Kong SAR, ChinaHungaryIBRD onlyIcelandIDA & IBRD totalIDA blendIDA onlyIDA totalIndiaIndonesiaIran, Islamic Rep.IraqIrelandIsraelItalyJamaicaJapanJordanKazakhstanKenyaKiribatiKorea, Dem. People’s Rep.Korea, Rep.KuwaitKyrgyz RepublicLao PDRLate-demographic dividendLatin America & Caribbean Latin America & Caribbean (excluding high income)Latin America & the Caribbean (IDA & IBRD countries)LatviaLeast developed countries: UN classificationLebanonLesothoLiberiaLibyaLithuaniaLow & middle incomeLow incomeLower middle incomeLuxembourgMacao SAR, ChinaMacedonia, FYRMadagascarMalawiMalaysiaMaldivesMaliMaltaMarshall IslandsMauritaniaMauritiusMexicoMiddle East & North AfricaMiddle East & North Africa (excluding high income)Middle East & North Africa (IDA & IBRD countries)Middle incomeMoldovaMonacoMongoliaMontenegroMoroccoMozambiqueMyanmarNamibiaNauruNepalNetherlandsNew ZealandNicaraguaNigerNigeriaNorth AmericaNorwayOECD membersOmanOther small statesPacific island small statesPakistanPanamaPapua New GuineaParaguayPeruPhilippinesPolandPortugalPost-demographic dividendPre-demographic dividendQatarRomaniaRussian FederationRwandaSamoaSao Tome and PrincipeSaudi ArabiaSenegalSerbiaSeychellesSierra LeoneSingaporeSlovak RepublicSloveniaSmall statesSolomon IslandsSomaliaSouth AfricaSouth AsiaSouth Asia (IDA & IBRD)SpainSri LankaSub-Saharan Africa Sub-Saharan Africa (excluding high income)Sub-Saharan Africa (IDA & IBRD countries)SudanSurinameSwazilandSwedenSwitzerlandSyrian Arab RepublicTajikistanTanzaniaThailandTogoTongaTrinidad and TobagoTunisiaTurkeyTurkmenistanUgandaUkraineUnited Arab EmiratesUnited KingdomUnited StatesUpper middle incomeUruguayUzbekistanVanuatuVenezuela, RBVietnamWorldYemen, Rep.ZambiaZimbabwe La ligne de temps
Cette échelle de temps montre un graphique de 1971 année à 2016 année Egypt, Arab Rep.. Les données jusqu'à 1970 année ne sont pas présentés. Quantité d'observations actuelles selon dates: 46.
Source (désignation):
Les indicateurs du développement mondiale
Source (organisation):
International Civil Aviation Organization, Civil Aviation Statistics of the World and ICAO staff estimates.
Catégories:
Infrastructure
Dernière mise à jour
23 avr. 2017
Les indicateurs de changement de valeurs selon les années
Maximum:
419.405
1 janv. 2015
Pour la date d''observation
Valeur
Changement absolu
Le changement par rapport à la valeur précédente
1 janv. 1971
15.3
+15.3
0.0%
1 janv. 1972
17.4
+2.1
13.73%
1 janv. 1973
17.8
+0.4
2.3%
1 janv. 1974
13.9
-3.9
-21.91%
1 janv. 1975
17.1
+3.2
23.02%
1 janv. 1976
20.7
+3.6
21.05%
1 janv. 1977
20.7
0.0
0.0%
1 janv. 1978
23.7
+3.0
14.49%
1 janv. 1979
24.7
+1.0
4.22%
1 janv. 1980
28.0
+3.3
13.36%
1 janv. 1981
29.4
+1.4
5.0%
1 janv. 1982
39.0
+9.6
32.65%
1 janv. 1983
53.5
+14.5
37.18%
1 janv. 1984
69.7
+16.2
30.28%
1 janv. 1985
88.2
+18.5
26.54%
1 janv. 1986
98.5
+10.3
11.68%
1 janv. 1987
111.5
+13.0
13.2%
1 janv. 1988
112.0
+0.5
0.45%
1 janv. 1989
118.8
+6.8
6.07%
1 janv. 1990
138.1
+19.3
16.25%
1 janv. 1991
144.0
+5.9
4.27%
1 janv. 1992
128.2
-15.8
-10.97%
1 janv. 1993
109.2
-19.0
-14.82%
1 janv. 1994
122.8
+13.6
12.45%
1 janv. 1995
185.2
+62.4
50.81%
1 janv. 1996
164.1
-21.1
-11.39%
1 janv. 1997
198.0
+33.9
20.66%
1 janv. 1998
208.6
+10.6
5.35%
1 janv. 1999
255.1
+46.5
22.29%
1 janv. 2000
269.5
+14.4
5.64%
1 janv. 2001
278.061
+8.561
3.18%
1 janv. 2002
239.036
-39.025
-14.03%
1 janv. 2003
249.206
+10.17
4.25%
1 janv. 2004
238.885
-10.321
-4.14%
1 janv. 2005
241.872
+2.987
1.25%
1 janv. 2006
286.954
+45.082
18.64%
1 janv. 2007
309.434
+22.48
7.83%
1 janv. 2008
206.828
-102.606
-33.16%
1 janv. 2009
195.482
-11.346
-5.49%
1 janv. 2010
180.31
-15.172
-7.76%
1 janv. 2011
416.985
+236.675
131.26%
1 janv. 2012
333.307
-83.678
-20.07%
1 janv. 2013
356.265
+22.959
6.89%
1 janv. 2014
386.683
+30.418
8.54%
1 janv. 2015
419.405
+32.722
8.46%
1 janv. 2016
397.532
-21.873
-5.22%
Classement des pays selon les statistiques actuelles par années


Commentaires: