29
/fr/
fr
AIzaSyAYiBZKx7MnpbEhh9jyipgxe19OcubqV5w
April 1, 2024
73329
Australia
AUS
true
2
1
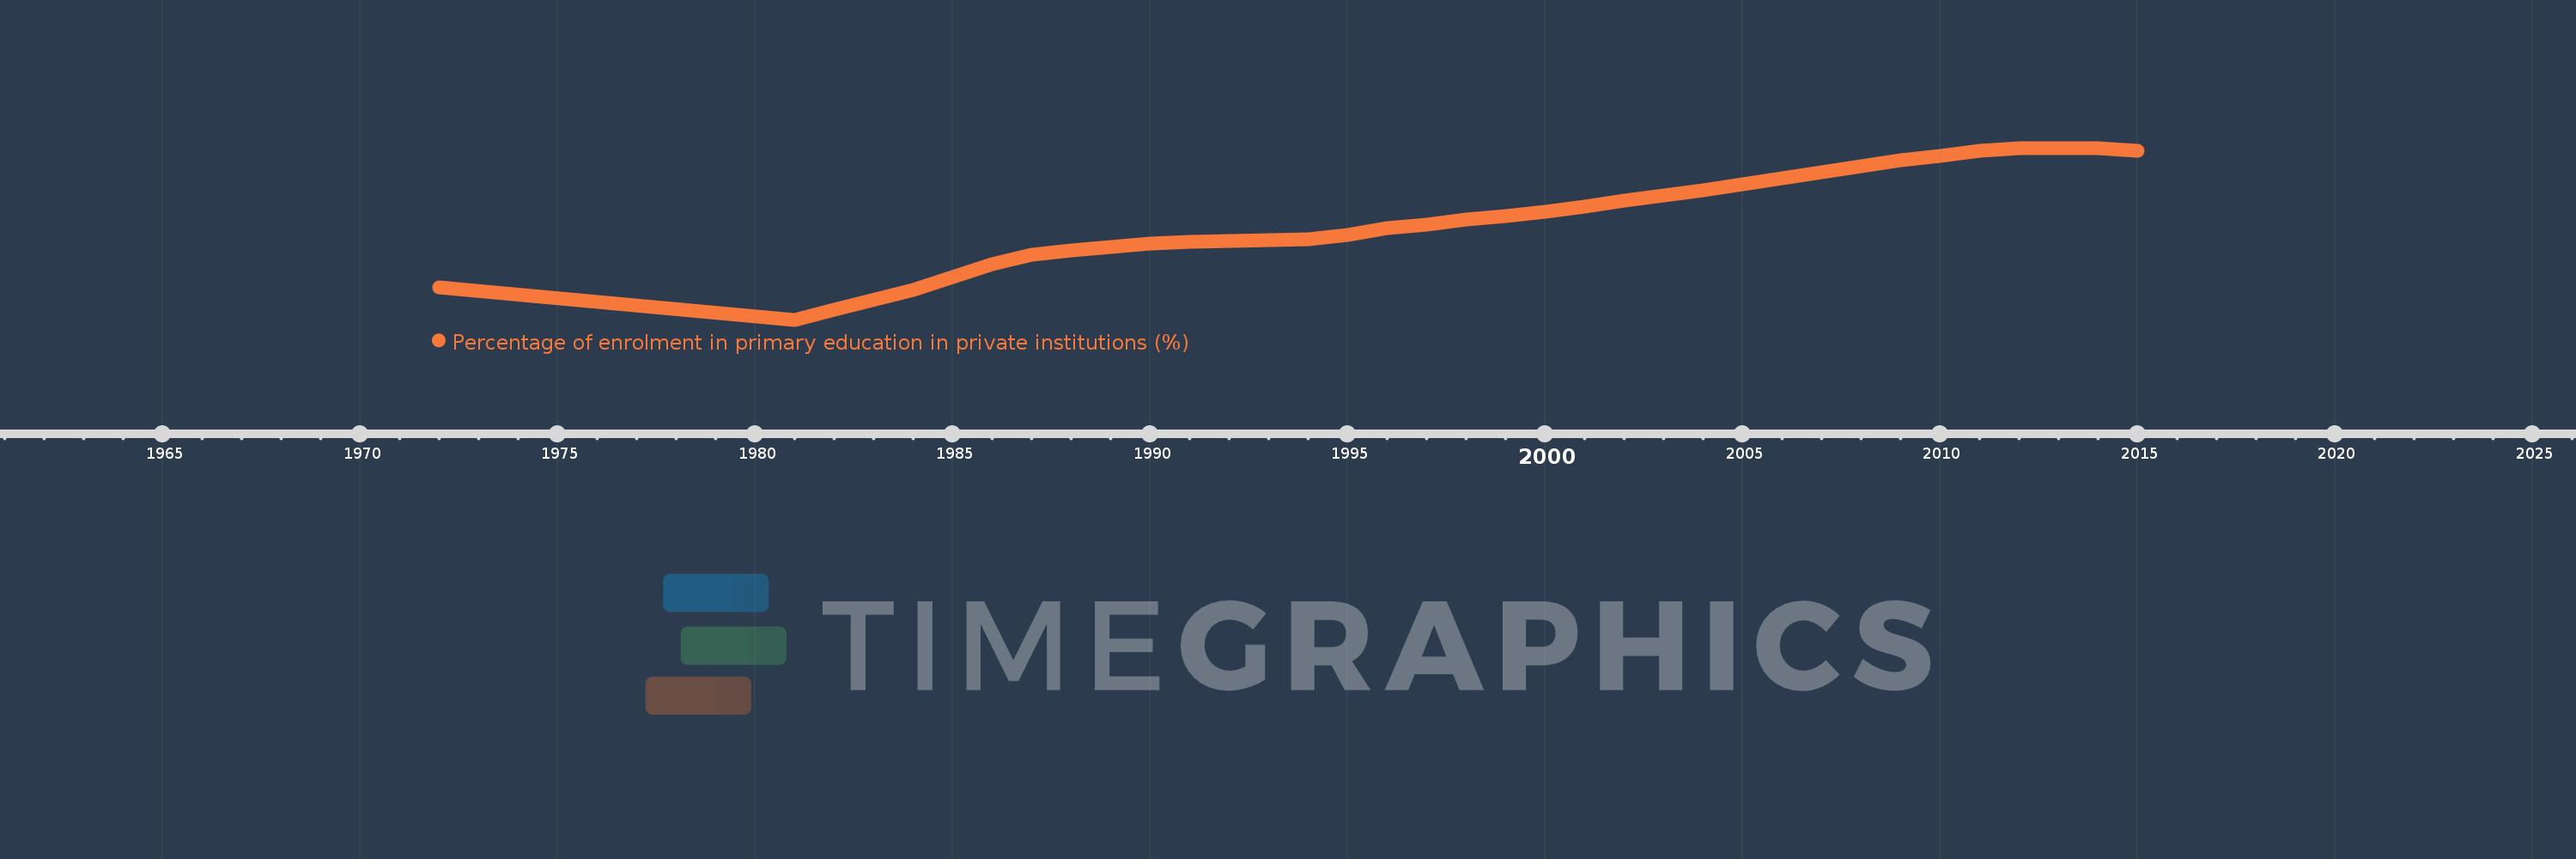
Percentage of enrolment in primary education in private institutions (%)
2015,2014,2013,2012,2011,2010,2009,2008,2007,2006,2005,2004,2003,2002,2001,2000,1999,1998,1997,1996,1995,1994,1993,1992,1991,1990,1989,1988,1987,1986,1985,1984,1982,1981,1972
Cette statistique dans les autres pays:
AfghanistanAlbaniaAlgeriaAndorraAngolaAntigua and BarbudaArab WorldArgentinaArmeniaArubaAustraliaAustriaAzerbaijanBahamas, TheBahrainBangladeshBarbadosBelarusBelgiumBelizeBeninBermudaBhutanBoliviaBosnia and HerzegovinaBotswanaBrazilBritish Virgin IslandsBrunei DarussalamBulgariaBurkina FasoBurundiCabo VerdeCambodiaCameroonCanadaCaribbean small statesCayman IslandsCentral African RepublicCentral Europe and the BalticsChadChileChinaColombiaComorosCongo, Dem. Rep.Congo, Rep.Costa RicaCote d'IvoireCroatiaCubaCuracaoCyprusCzech RepublicDenmarkDjiboutiDominicaDominican RepublicEarly-demographic dividendEast Asia & PacificEast Asia & Pacific (excluding high income)East Asia & Pacific (IDA & IBRD countries)EcuadorEgypt, Arab Rep.El SalvadorEquatorial GuineaEritreaEstoniaEthiopiaEuro areaEurope & Central AsiaEurope & Central Asia (excluding high income)Europe & Central Asia (IDA & IBRD countries)European UnionFijiFinlandFragile and conflict affected situationsFranceGabonGambia, TheGeorgiaGermanyGhanaGibraltarGreeceGrenadaGuatemalaGuineaGuinea-BissauGuyanaHaitiHeavily indebted poor countries (HIPC)High incomeHondurasHong Kong SAR, ChinaHungaryIBRD onlyIcelandIDA & IBRD totalIDA blendIDA onlyIDA totalIndiaIndonesiaIran, Islamic Rep.IraqIrelandIsraelItalyJamaicaJapanJordanKazakhstanKenyaKiribatiKorea, Rep.KuwaitKyrgyz RepublicLao PDRLate-demographic dividendLatin America & Caribbean Latin America & Caribbean (excluding high income)Latin America & the Caribbean (IDA & IBRD countries)LatviaLeast developed countries: UN classificationLebanonLesothoLiberiaLibyaLiechtensteinLithuaniaLow & middle incomeLow incomeLower middle incomeLuxembourgMacao SAR, ChinaMacedonia, FYRMadagascarMalawiMalaysiaMaldivesMaliMaltaMarshall IslandsMauritaniaMauritiusMexicoMiddle East & North AfricaMiddle East & North Africa (excluding high income)Middle East & North Africa (IDA & IBRD countries)Middle incomeMoldovaMonacoMongoliaMoroccoMozambiqueMyanmarNamibiaNauruNepalNetherlandsNew ZealandNicaraguaNigerNigeriaNorth AmericaNorwayOECD membersOmanOther small statesPacific island small statesPakistanPalauPanamaPapua New GuineaParaguayPeruPhilippinesPolandPortugalPost-demographic dividendPre-demographic dividendPuerto RicoQatarRomaniaRussian FederationRwandaSamoaSan MarinoSao Tome and PrincipeSaudi ArabiaSenegalSerbiaSeychellesSierra LeoneSingaporeSlovak RepublicSloveniaSmall statesSolomon IslandsSomaliaSouth AfricaSouth AsiaSouth Asia (IDA & IBRD)SpainSri LankaSt. Kitts and NevisSt. LuciaSt. Vincent and the GrenadinesSub-Saharan Africa Sub-Saharan Africa (excluding high income)Sub-Saharan Africa (IDA & IBRD countries)SudanSurinameSwazilandSwedenSwitzerlandSyrian Arab RepublicTajikistanTanzaniaThailandTimor-LesteTogoTongaTrinidad and TobagoTunisiaTurkeyTurks and Caicos IslandsTuvaluUgandaUkraineUnited Arab EmiratesUnited KingdomUnited StatesUpper middle incomeUruguayVanuatuVenezuela, RBVietnamWest Bank and GazaWorldYemen, Rep.ZambiaZimbabwe La ligne de temps
Cette échelle de temps montre un graphique de 1972 année à 2015 année Australia. Les données jusqu'à 1971 année ne sont pas présentés. Quantité d'observations actuelles selon dates: 35.
Source (désignation):
Les indicateurs du développement mondiale
Source (organisation):
UNESCO Institute for Statistics
Catégories:
Education
Dernière mise à jour
23 avr. 2017
Les indicateurs de changement de valeurs selon les années
Minimum:
19.717
1 janv. 1981
Maximum:
31.085
1 janv. 2013
Pour la date d''observation
Valeur
Changement absolu
Le changement par rapport à la valeur précédente
1 janv. 1972
21.859
+21.859
0.0%
1 janv. 1981
19.717
-2.142
-9.8%
1 janv. 1982
20.379
+0.662
3.36%
1 janv. 1984
21.708
+1.329
6.52%
1 janv. 1985
22.537
+0.829
3.82%
1 janv. 1986
23.403
+0.866
3.84%
1 janv. 1987
23.997
+0.594
2.54%
1 janv. 1988
24.299
+0.301
1.25%
1 janv. 1989
24.559
+0.261
1.07%
1 janv. 1990
24.778
+0.219
0.89%
1 janv. 1991
24.873
+0.095
0.38%
1 janv. 1992
24.944
+0.071
0.28%
1 janv. 1993
24.97
+0.026
0.1%
1 janv. 1994
25.055
+0.085
0.34%
1 janv. 1995
25.353
+0.299
1.19%
1 janv. 1996
25.762
+0.409
1.61%
1 janv. 1997
26.013
+0.251
0.97%
1 janv. 1998
26.338
+0.325
1.25%
1 janv. 1999
26.602
+0.264
1.0%
1 janv. 2000
26.863
+0.261
0.98%
1 janv. 2001
27.219
+0.356
1.32%
1 janv. 2002
27.604
+0.385
1.42%
1 janv. 2003
27.966
+0.362
1.31%
1 janv. 2004
28.302
+0.336
1.2%
1 janv. 2005
28.677
+0.374
1.32%
1 janv. 2006
29.098
+0.421
1.47%
1 janv. 2007
29.455
+0.357
1.23%
1 janv. 2008
29.846
+0.391
1.33%
1 janv. 2009
30.263
+0.417
1.4%
1 janv. 2010
30.55
+0.287
0.95%
1 janv. 2011
30.872
+0.323
1.06%
1 janv. 2012
31.082
+0.209
0.68%
1 janv. 2013
31.085
+0.003
0.01%
1 janv. 2014
31.044
-0.04
-0.13%
1 janv. 2015
30.907
-0.137
-0.44%
Classement des pays selon les statistiques actuelles par années


Commentaires: