29
/fr/
fr
AIzaSyAYiBZKx7MnpbEhh9jyipgxe19OcubqV5w
April 1, 2024
70513
Argentina
ARG
true
2
1
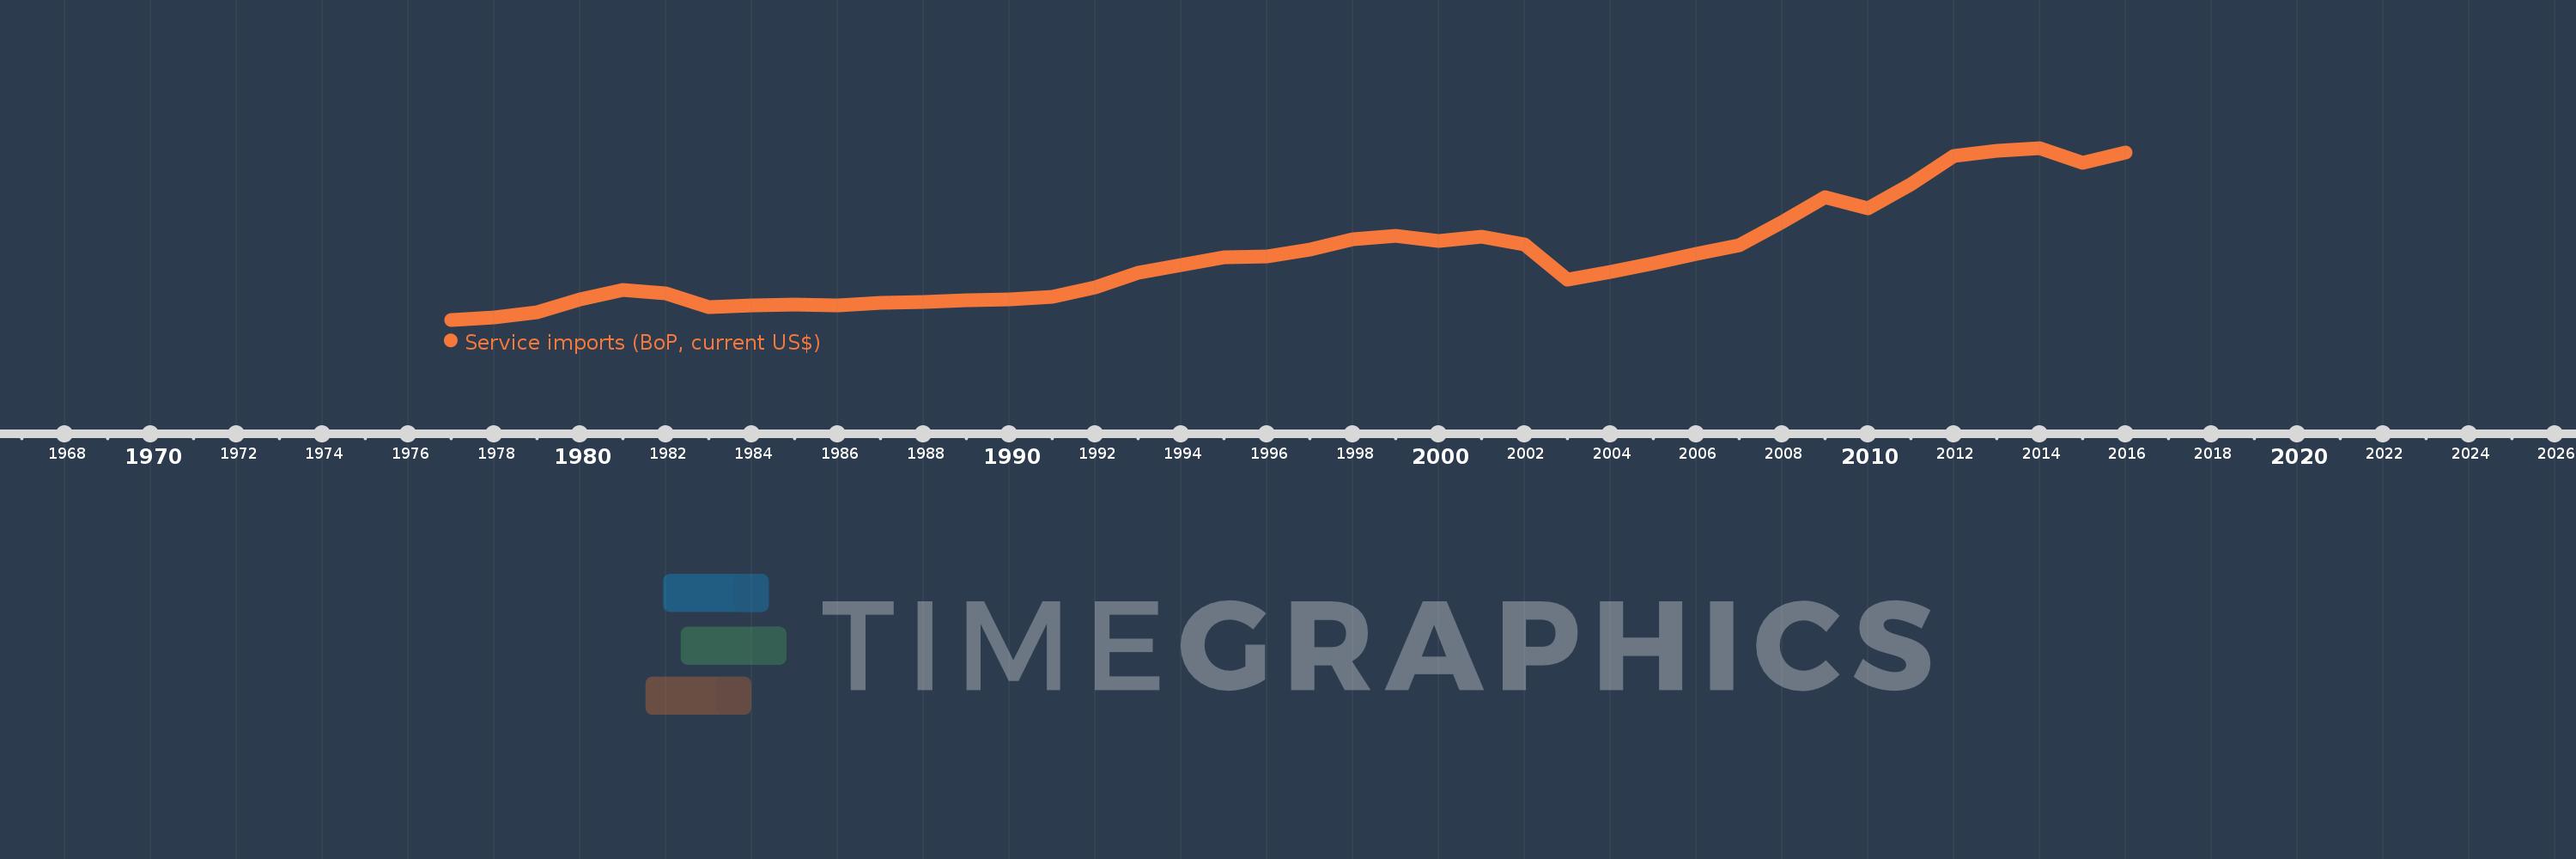
Service imports (BoP, current US$)
2016,2015,2014,2013,2012,2011,2010,2009,2008,2007,2006,2005,2004,2003,2002,2001,2000,1999,1998,1997,1996,1995,1994,1993,1992,1991,1990,1989,1988,1987,1986,1985,1984,1983,1982,1981,1980,1979,1978,1977
Cette statistique dans les autres pays:
AfghanistanAlbaniaAlgeriaAngolaAntigua and BarbudaArab WorldArgentinaArmeniaArubaAustraliaAustriaAzerbaijanBahamas, TheBahrainBangladeshBarbadosBelarusBelgiumBelizeBeninBermudaBhutanBoliviaBosnia and HerzegovinaBotswanaBrazilBrunei DarussalamBulgariaBurkina FasoBurundiCabo VerdeCambodiaCameroonCanadaCaribbean small statesCentral African RepublicCentral Europe and the BalticsChadChileChinaColombiaComorosCongo, Dem. Rep.Congo, Rep.Costa RicaCote d'IvoireCroatiaCuracaoCyprusCzech RepublicDenmarkDjiboutiDominicaDominican RepublicEarly-demographic dividendEast Asia & PacificEast Asia & Pacific (excluding high income)East Asia & Pacific (IDA & IBRD countries)EcuadorEgypt, Arab Rep.El SalvadorEquatorial GuineaEritreaEstoniaEthiopiaEuro areaEurope & Central AsiaEurope & Central Asia (excluding high income)Europe & Central Asia (IDA & IBRD countries)European UnionFaroe IslandsFijiFinlandFragile and conflict affected situationsFranceFrench PolynesiaGabonGambia, TheGeorgiaGermanyGhanaGreeceGrenadaGuatemalaGuineaGuinea-BissauGuyanaHaitiHeavily indebted poor countries (HIPC)High incomeHondurasHong Kong SAR, ChinaHungaryIBRD onlyIcelandIDA & IBRD totalIDA blendIDA onlyIDA totalIndiaIndonesiaIran, Islamic Rep.IraqIrelandIsraelItalyJamaicaJapanJordanKazakhstanKenyaKiribatiKorea, Rep.KosovoKuwaitKyrgyz RepublicLao PDRLate-demographic dividendLatin America & Caribbean Latin America & Caribbean (excluding high income)Latin America & the Caribbean (IDA & IBRD countries)LatviaLeast developed countries: UN classificationLebanonLesothoLiberiaLibyaLithuaniaLow & middle incomeLow incomeLower middle incomeLuxembourgMacao SAR, ChinaMacedonia, FYRMadagascarMalawiMalaysiaMaldivesMaliMaltaMarshall IslandsMauritaniaMauritiusMexicoMicronesia, Fed. Sts.Middle East & North Africa (excluding high income)Middle East & North Africa (IDA & IBRD countries)Middle incomeMoldovaMongoliaMontenegroMoroccoMozambiqueMyanmarNamibiaNepalNetherlandsNew CaledoniaNew ZealandNicaraguaNigerNigeriaNorth AmericaNorwayOECD membersOmanOther small statesPacific island small statesPakistanPalauPanamaPapua New GuineaParaguayPeruPhilippinesPolandPortugalPost-demographic dividendPre-demographic dividendQatarRomaniaRussian FederationRwandaSamoaSao Tome and PrincipeSaudi ArabiaSenegalSerbiaSeychellesSierra LeoneSingaporeSint Maarten (Dutch part)Slovak RepublicSloveniaSmall statesSolomon IslandsSouth AfricaSouth AsiaSouth Asia (IDA & IBRD)South SudanSpainSri LankaSt. Kitts and NevisSt. LuciaSt. Vincent and the GrenadinesSub-Saharan Africa Sub-Saharan Africa (excluding high income)Sub-Saharan Africa (IDA & IBRD countries)SudanSurinameSwazilandSwedenSwitzerlandSyrian Arab RepublicTajikistanTanzaniaThailandTimor-LesteTogoTongaTrinidad and TobagoTunisiaTurkeyTuvaluUgandaUkraineUnited KingdomUnited StatesUpper middle incomeUruguayVanuatuVenezuela, RBVietnamWest Bank and GazaWorldYemen, Rep.ZambiaZimbabwe La ligne de temps
Cette échelle de temps montre un graphique de 1977 année à 2016 année Argentina. Les données jusqu'à 1976 année ne sont pas présentés. Quantité d'observations actuelles selon dates: 40.
Source (désignation):
Les indicateurs du développement mondiale
Source (organisation):
International Monetary Fund, Balance of Payments Statistics Yearbook and data files.
Catégories:
Economy & Growth, Trade
Dernière mise à jour
23 avr. 2017
Les indicateurs de changement de valeurs selon les années
Minimum:
742.0 mln.
1 janv. 1977
Maximum:
18.282 mds
1 janv. 2014
Pour la date d''observation
Valeur
Changement absolu
Le changement par rapport à la valeur précédente
1 janv. 1977
742.0 mln.
+742.0 mln.
0.0%
1 janv. 1978
967.0 mln.
+225.0 mln.
30.32%
1 janv. 1979
1.544 mds
+577.0 mln.
59.67%
1 janv. 1980
2.814 mds
+1.27 mds
82.25%
1 janv. 1981
3.788 mds
+974.0 mln.
34.61%
1 janv. 1982
3.434 mds
-354.0 mln.
-9.35%
1 janv. 1983
2.018 mds
-1.416 mds
-41.23%
1 janv. 1984
2.224 mds
+206.0 mln.
10.21%
1 janv. 1985
2.289 mds
+65.0 mln.
2.92%
1 janv. 1986
2.187 mds
-102.0 mln.
-4.46%
1 janv. 1987
2.5 mds
+313.0 mln.
14.31%
1 janv. 1988
2.566 mds
+66.0 mln.
2.64%
1 janv. 1989
2.702 mds
+136.0 mln.
5.3%
1 janv. 1990
2.793 mds
+91.0 mln.
3.37%
1 janv. 1991
3.12 mds
+327.0 mln.
11.71%
1 janv. 1992
4.007 mds
+887.0 mln.
28.43%
1 janv. 1993
5.525 mds
+1.518 mds
37.88%
1 janv. 1994
6.343 mds
+818.2 mln.
14.81%
1 janv. 1995
7.111 mds
+768.5 mln.
12.12%
1 janv. 1996
7.231 mds
+119.4 mln.
1.68%
1 janv. 1997
7.929 mds
+698.204 mln.
9.66%
1 janv. 1998
8.958 mds
+1.029 mds
12.98%
1 janv. 1999
9.267 mds
+308.531 mln.
3.44%
1 janv. 2000
8.8 mds
-466.741 mln.
-5.04%
1 janv. 2001
9.18 mds
+379.827 mln.
4.32%
1 janv. 2002
8.437 mds
-742.561 mln.
-8.09%
1 janv. 2003
4.864 mds
-3.573 mds
-42.35%
1 janv. 2004
5.59 mds
+726.19 mln.
14.93%
1 janv. 2005
6.513 mds
+922.23 mln.
16.5%
1 janv. 2006
7.497 mds
+984.35 mln.
15.11%
1 janv. 2007
8.386 mds
+888.78 mln.
11.86%
1 janv. 2008
10.702 mds
+2.316 mds
27.62%
1 janv. 2009
13.254 mds
+2.552 mds
23.85%
1 janv. 2010
12.081 mds
-1.173 mds
-8.85%
1 janv. 2011
14.614 mds
+2.533 mds
20.96%
1 janv. 2012
17.469 mds
+2.855 mds
19.54%
1 janv. 2013
17.991 mds
+521.896 mln.
2.99%
1 janv. 2014
18.282 mds
+290.574 mln.
1.62%
1 janv. 2015
16.801 mds
-1.481 mds
-8.1%
1 janv. 2016
17.841 mds
+1.04 mds
6.19%
Classement des pays selon les statistiques actuelles par années


Commentaires: