29
/fr/
fr
AIzaSyAYiBZKx7MnpbEhh9jyipgxe19OcubqV5w
April 1, 2024
265280
Togo
TGO
true
2
1
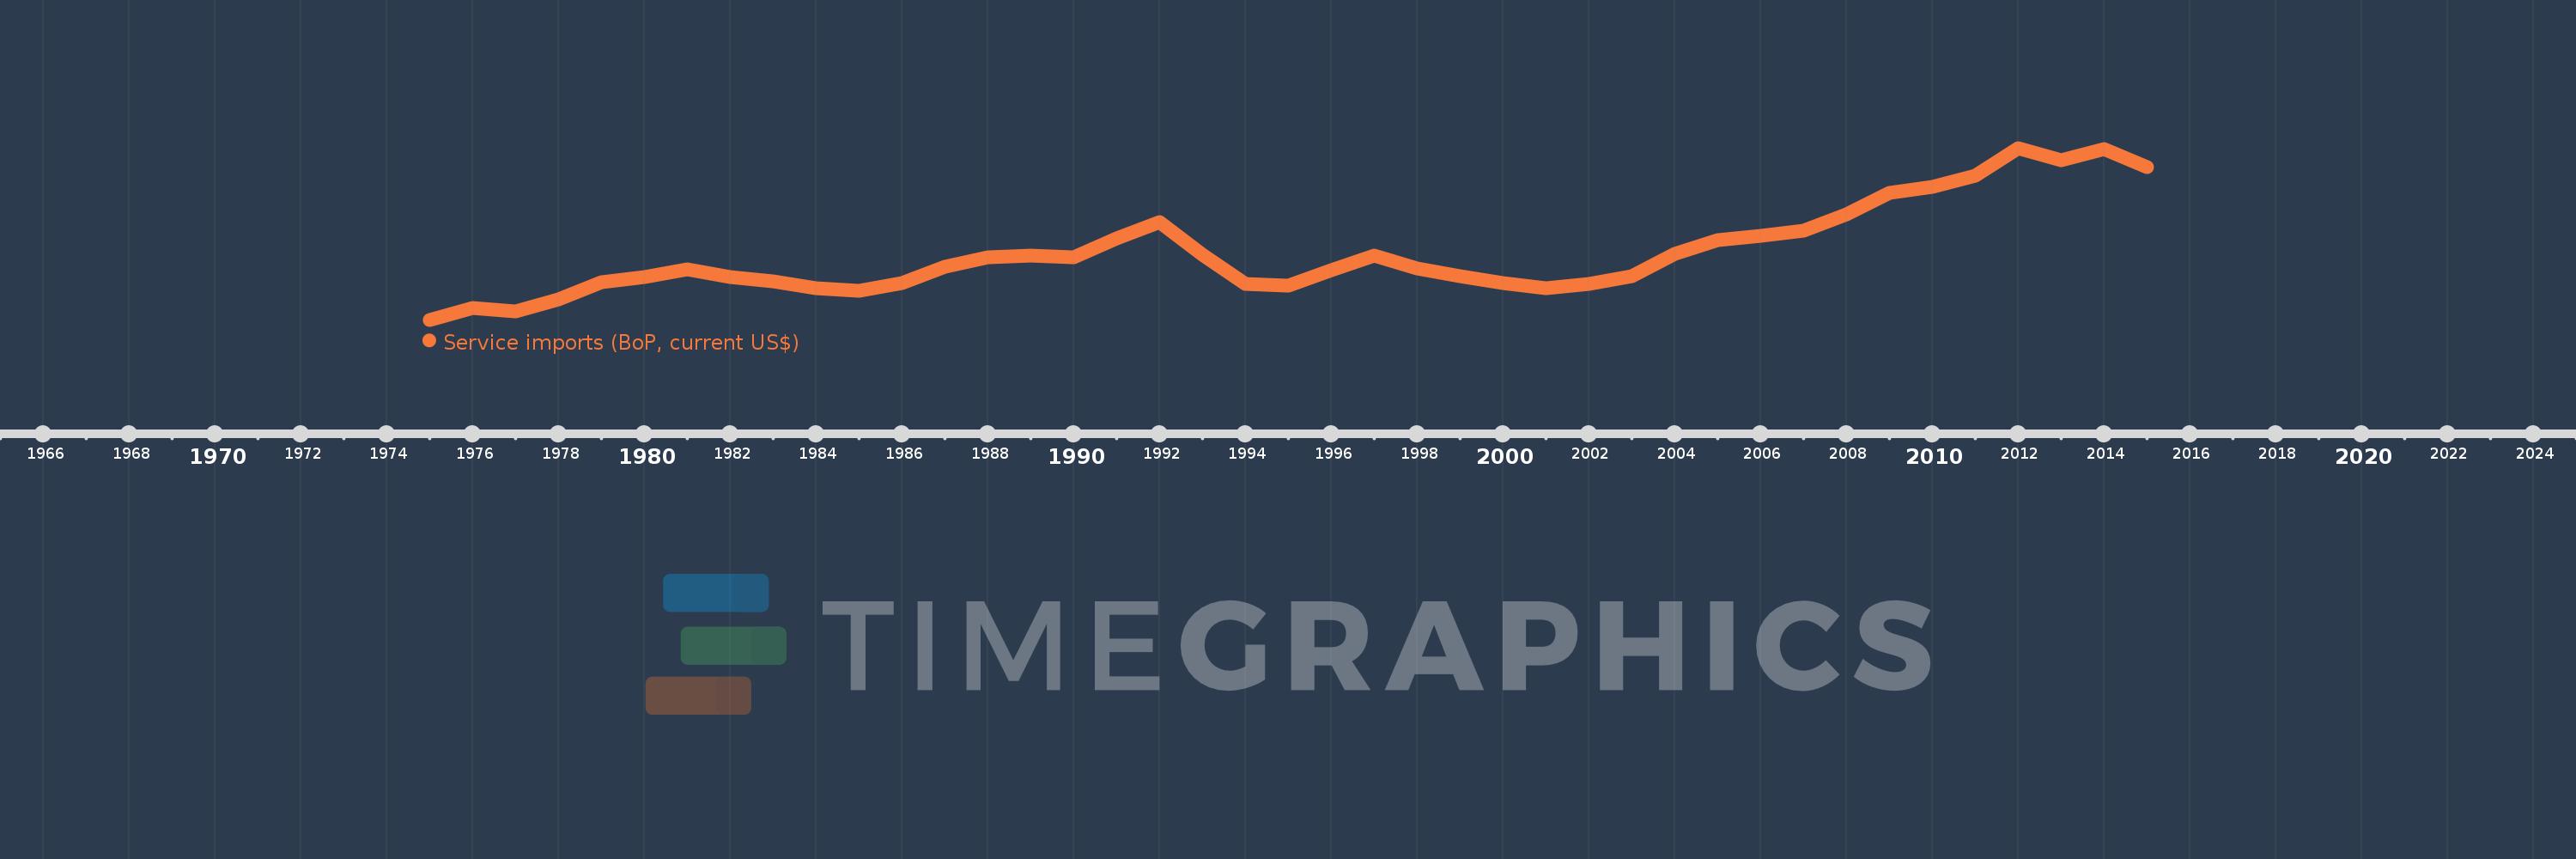
Service imports (BoP, current US$)
2015,2014,2013,2012,2011,2010,2009,2008,2007,2006,2005,2004,2003,2002,2001,2000,1999,1998,1997,1996,1995,1994,1993,1992,1991,1990,1989,1988,1987,1986,1985,1984,1983,1982,1981,1980,1979,1978,1977,1976,1975
Cette statistique dans les autres pays:
AfghanistanAlbaniaAlgeriaAngolaAntigua and BarbudaArab WorldArgentinaArmeniaArubaAustraliaAustriaAzerbaijanBahamas, TheBahrainBangladeshBarbadosBelarusBelgiumBelizeBeninBermudaBhutanBoliviaBosnia and HerzegovinaBotswanaBrazilBrunei DarussalamBulgariaBurkina FasoBurundiCabo VerdeCambodiaCameroonCanadaCaribbean small statesCentral African RepublicCentral Europe and the BalticsChadChileChinaColombiaComorosCongo, Dem. Rep.Congo, Rep.Costa RicaCote d'IvoireCroatiaCuracaoCyprusCzech RepublicDenmarkDjiboutiDominicaDominican RepublicEarly-demographic dividendEast Asia & PacificEast Asia & Pacific (excluding high income)East Asia & Pacific (IDA & IBRD countries)EcuadorEgypt, Arab Rep.El SalvadorEquatorial GuineaEritreaEstoniaEthiopiaEuro areaEurope & Central AsiaEurope & Central Asia (excluding high income)Europe & Central Asia (IDA & IBRD countries)European UnionFaroe IslandsFijiFinlandFragile and conflict affected situationsFranceFrench PolynesiaGabonGambia, TheGeorgiaGermanyGhanaGreeceGrenadaGuatemalaGuineaGuinea-BissauGuyanaHaitiHeavily indebted poor countries (HIPC)High incomeHondurasHong Kong SAR, ChinaHungaryIBRD onlyIcelandIDA & IBRD totalIDA blendIDA onlyIDA totalIndiaIndonesiaIran, Islamic Rep.IraqIrelandIsraelItalyJamaicaJapanJordanKazakhstanKenyaKiribatiKorea, Rep.KosovoKuwaitKyrgyz RepublicLao PDRLate-demographic dividendLatin America & Caribbean Latin America & Caribbean (excluding high income)Latin America & the Caribbean (IDA & IBRD countries)LatviaLeast developed countries: UN classificationLebanonLesothoLiberiaLibyaLithuaniaLow & middle incomeLow incomeLower middle incomeLuxembourgMacao SAR, ChinaMacedonia, FYRMadagascarMalawiMalaysiaMaldivesMaliMaltaMarshall IslandsMauritaniaMauritiusMexicoMicronesia, Fed. Sts.Middle East & North Africa (excluding high income)Middle East & North Africa (IDA & IBRD countries)Middle incomeMoldovaMongoliaMontenegroMoroccoMozambiqueMyanmarNamibiaNepalNetherlandsNew CaledoniaNew ZealandNicaraguaNigerNigeriaNorth AmericaNorwayOECD membersOmanOther small statesPacific island small statesPakistanPalauPanamaPapua New GuineaParaguayPeruPhilippinesPolandPortugalPost-demographic dividendPre-demographic dividendQatarRomaniaRussian FederationRwandaSamoaSao Tome and PrincipeSaudi ArabiaSenegalSerbiaSeychellesSierra LeoneSingaporeSint Maarten (Dutch part)Slovak RepublicSloveniaSmall statesSolomon IslandsSouth AfricaSouth AsiaSouth Asia (IDA & IBRD)South SudanSpainSri LankaSt. Kitts and NevisSt. LuciaSt. Vincent and the GrenadinesSub-Saharan Africa Sub-Saharan Africa (excluding high income)Sub-Saharan Africa (IDA & IBRD countries)SudanSurinameSwazilandSwedenSwitzerlandSyrian Arab RepublicTajikistanTanzaniaThailandTimor-LesteTogoTongaTrinidad and TobagoTunisiaTurkeyTuvaluUgandaUkraineUnited KingdomUnited StatesUpper middle incomeUruguayVanuatuVenezuela, RBVietnamWest Bank and GazaWorldYemen, Rep.ZambiaZimbabwe La ligne de temps
Cette échelle de temps montre un graphique de 1975 année à 2015 année Togo. Les données jusqu'à 1974 année ne sont pas présentés. Quantité d'observations actuelles selon dates: 41.
Source (désignation):
Les indicateurs du développement mondiale
Source (organisation):
International Monetary Fund, Balance of Payments Statistics Yearbook and data files.
Catégories:
Economy & Growth, Trade
Dernière mise à jour
23 avr. 2017
Les indicateurs de changement de valeurs selon les années
Minimum:
38.229 mln.
1 janv. 1975
Maximum:
473.537 mln.
1 janv. 2012
Pour la date d''observation
Valeur
Changement absolu
Le changement par rapport à la valeur précédente
1 janv. 1975
38.229 mln.
+38.229 mln.
0.0%
1 janv. 1976
69.109 mln.
+30.88 mln.
80.77%
1 janv. 1977
60.012 mln.
-9.097 mln.
-13.16%
1 janv. 1978
90.284 mln.
+30.272 mln.
50.44%
1 janv. 1979
134.164 mln.
+43.88 mln.
48.6%
1 janv. 1980
145.392 mln.
+11.227 mln.
8.37%
1 janv. 1981
166.77 mln.
+21.378 mln.
14.7%
1 janv. 1982
145.96 mln.
-20.809 mln.
-12.48%
1 janv. 1983
136.026 mln.
-9.934 mln.
-6.81%
1 janv. 1984
117.728 mln.
-18.298 mln.
-13.45%
1 janv. 1985
112.608 mln.
-5.119 mln.
-4.35%
1 janv. 1986
131.823 mln.
+19.214 mln.
17.06%
1 janv. 1987
172.29 mln.
+40.467 mln.
30.7%
1 janv. 1988
196.575 mln.
+24.285 mln.
14.1%
1 janv. 1989
200.179 mln.
+3.604 mln.
1.83%
1 janv. 1990
195.822 mln.
-4.357 mln.
-2.18%
1 janv. 1991
244.097 mln.
+48.274 mln.
24.65%
1 janv. 1992
286.253 mln.
+42.156 mln.
17.27%
1 janv. 1993
203.255 mln.
-82.998 mln.
-28.99%
1 janv. 1994
128.23 mln.
-75.025 mln.
-36.91%
1 janv. 1995
125.332 mln.
-2.898 mln.
-2.26%
1 janv. 1996
164.256 mln.
+38.924 mln.
31.06%
1 janv. 1997
201.405 mln.
+37.149 mln.
22.62%
1 janv. 1998
167.884 mln.
-33.52 mln.
-16.64%
1 janv. 1999
149.268 mln.
-18.616 mln.
-11.09%
1 janv. 2000
130.591 mln.
-18.677 mln.
-12.51%
1 janv. 2001
117.661 mln.
-12.93 mln.
-9.9%
1 janv. 2002
129.902 mln.
+12.241 mln.
10.4%
1 janv. 2003
148.183 mln.
+18.282 mln.
14.07%
1 janv. 2004
204.312 mln.
+56.128 mln.
37.88%
1 janv. 2005
239.331 mln.
+35.019 mln.
17.14%
1 janv. 2006
250.704 mln.
+11.373 mln.
4.75%
1 janv. 2007
264.149 mln.
+13.445 mln.
5.36%
1 janv. 2008
305.456 mln.
+41.307 mln.
15.64%
1 janv. 2009
359.174 mln.
+53.718 mln.
17.59%
1 janv. 2010
374.718 mln.
+15.544 mln.
4.33%
1 janv. 2011
403.966 mln.
+29.248 mln.
7.81%
1 janv. 2012
473.537 mln.
+69.571 mln.
17.22%
1 janv. 2013
442.023 mln.
-31.514 mln.
-6.65%
1 janv. 2014
471.344 mln.
+29.321 mln.
6.63%
1 janv. 2015
426.023 mln.
-45.321 mln.
-9.62%
Classement des pays selon les statistiques actuelles par années


Commentaires: